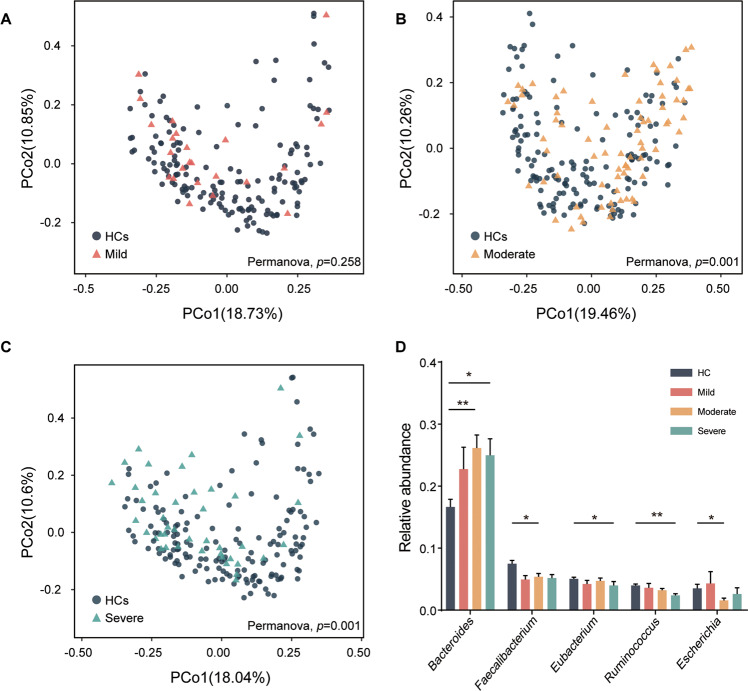
Fig. 2. Gut microbial characteristics among HCs and MDD subgroups.
A–C Principal co-ordinates analysis (PCoA) was conducted based on species level and Bray-Curtis distance. PERMANOVA test showed that the general characteristics of microbiota in moderate and severe groups were significantly different from HCs, while there was no significant difference between mild group and HCs. In addition, we did not find the separated characteristics of microbiota by comparing disease subgroups (see Fig. S2). D The bar plot showed the differentially enriched genus in the most top 10 high relative abundance genus. Bacteroides was significantly increased in moderate and severe group, while the reduction of 2 genera (Faecalibacterium and Escherichia) in moderate group and 2 genera (Eubacterium and Ruminococcus) in severe group, respectively. (*p < 0.05; **p < 0.01; Kruskal–Wallis rank sum test).

