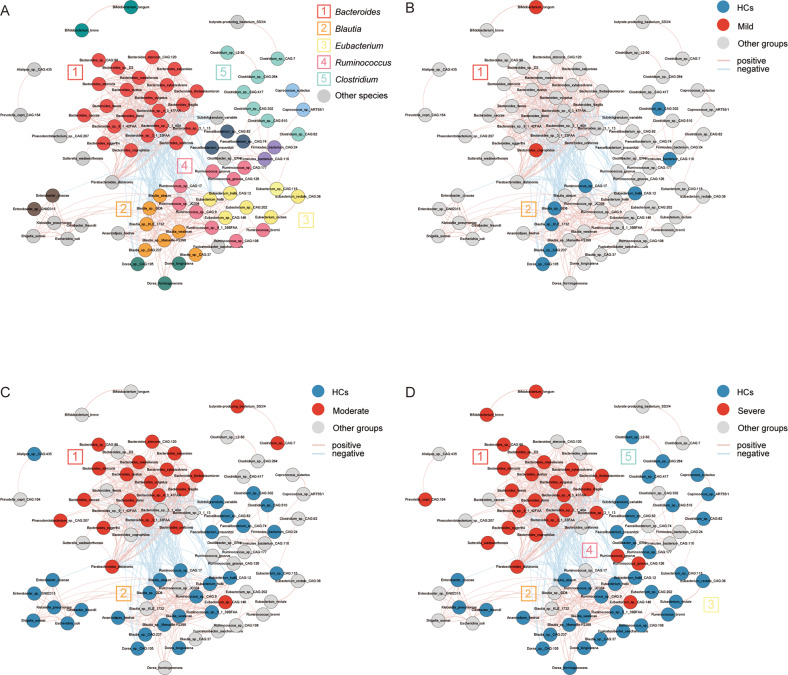
Fig. 4. The co-occurrence network constructed from the relative abundance of differentially enriched bacteria species among HCs and MDD subgroups.
The network was mapped based on the result (p < 0.05, r2 > 0.25). A Correlation among abundances of all differentially enriched bacteria were analyzed with SparCC algorithm, clusters were assigned a particular color and main clusters had a corresponding number. B, D Species enriched in MDD subgroups were highlighted in red and depleted ones were in blue. Pink lines represented positive correlations and blue lines means negative correlations. B Bacteria altered little in mild group, some scattered species were depleted in mild groups associated with each other weakly and had no correlation with the only enriched Bacteroides in cluster 1. C Bacteria enriched in moderate groups were almost all belong to Bacteroides in cluster 1, the major depleted genus was Blutia in cluster 2, which have a significantly negative association with Bacteroides. D Gut microbiota of severe group appeared fierce disturbance featured with markable increase of Bacteroides in cluster 1. Ruminococcus, Blautia, Eubacterium and Clostridium (cluster 2, 3, 4, 5) were obviously decreased as a group. There were complex positive correlations within cluster 2, 3, 4 and a significantly negative correlation between the decreased group and Bacteroides. It revealed that there was a potential antagonistic relationship between the decreased group and Bacteroides.

