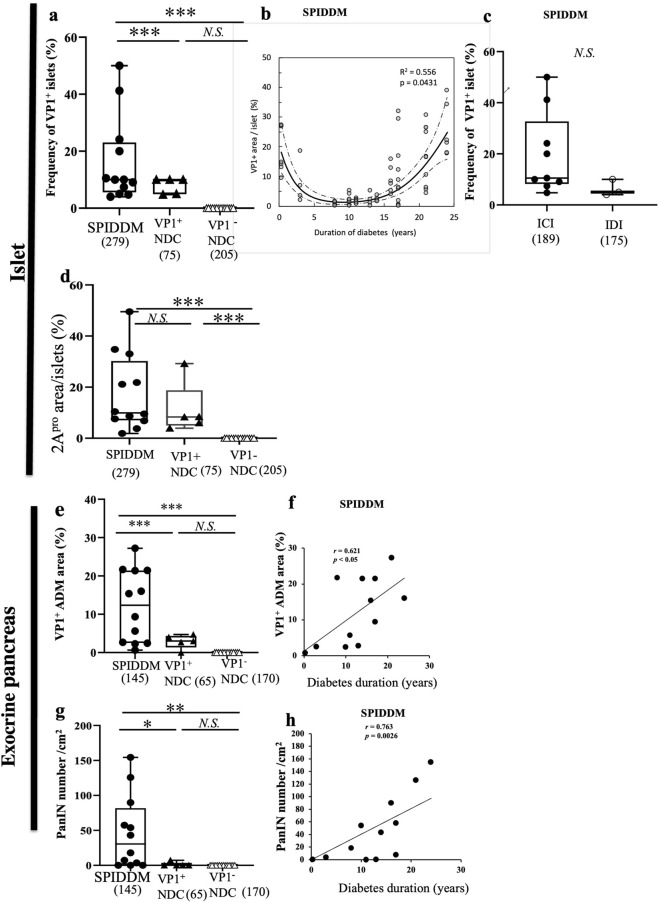
Figure 3.
Quantified enterovirus (EV)-VP1 area in the islets, VP1-positive ADM cell area, and pancreatic intraepithelial neoplasia (PanIN) number in the exocrine pancreas of SPIDDM and non-diabetic control (non-DC) pancreas. (a) Overall frequencies of VP1-positive islets in SPIDDM and non-DC pancreases with medians depicted by box-and-whisker plots. The box represents the mid 50% of the data, and high and low whiskers represent the 95th and 5th percentiles, respectively. Open triangles show data for VP1-positive non-DC pancreases. Numbers in parentheses indicate numbers of islets counted. **P < 0.001 by the Mann–Whitney U test. (b) The islet VP1-positive area relative to the area of islets as related to the duration of diabetes in SPIDDM patients. The solid curve is a third-order polynomial function of the diabetes duration. A 95% confidence interval of the polynomial function was also constructed (dashed line). The fractional VP1-positive areas were cubic-root transformed to remove heterogeneity of the variance, which is significantly smaller in subjects with lower values of VP1-positive fractional area. The cube-root transform was also effective to remove the significant deviation of the fractional VP1-positive area from the normal distribution as judged by the Shapiro–Wilk test. Coefficients for the terms from 1st to 3rd orders were tested for statistical significance, and the p-value of the 3rd-order term is shown (P = 0.0431, n = 47). (c) Areas of VP1-positive islet area in insulin-containing islets (ICIs) and insulin-deficient islets (IDCs) in SPIDDM are insignificant. Open circles show cases completely devoid of residual beta cells. Numbers in parentheses indicate the number of islets counted. N.S. between two groups by the Mann–Whitney U test. (d) Areas of 2Apro-positive islet area in SPIDDM, VP1-positive non-diabetic controls (NDCs) were elevated but insignificant. Kruskal–Wallis test was used and numbers in parentheses indicate the number of islets counted. (e) Areas of VP1-positive ADM are significantly higher in SPIDDM pancreases than in VP1-positive non-DCs. Numbers in parentheses indicate the number of counted fields. ***P < 0.0001 by the Mann–Whitney U test. (f) VP1-positive ADM areas increase with increased duration of diabetes in SPIDDM. P < 0.05, Pearson’s correlation coefficient. (g) PanIN numbers per exocrine areas are significantly higher in SPIDDM than in non-DC. The number in parentheses indicates the number of counted fields. **P < 0.007, Mann–Whitney U test. (h) PanIN-positive lobe number in the exocrine pancreas increases with increased duration of diabetes in SPIDDM. P < 0.0026, Pearson’s correlation coefficient.

