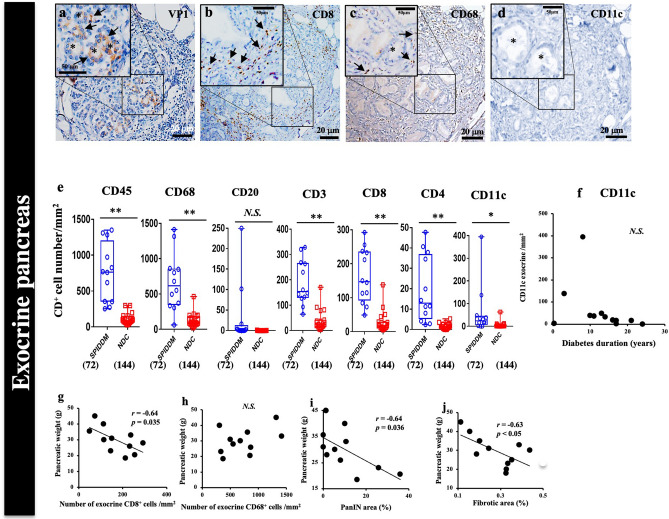
Figure 7.
EV and pancreatic exocrine tissue inflammation and association with pancreatic weight in SPIDDM. (a–d) Serial sections of exocrine pancreas in a PanIN lobe stained for VP1 (a), CD8 (b), CD68 (c), and CD11c (d) in SPIDDM (Case SP2). VP1- and ADM-positive cell clusters (a, brown) are infiltrated by CD8+ T cells (b) and CD68+ macrophages (c). No CD11c+ cells are observed (d). Asterisks: ADM-changed acinar cells. (e) Numbers of CD45+, CD68+, CD8+, CD4+, and CD11c+ cells, but not CD20+ cells, in the exocrine pancreas are significantly higher in SPIDDM patients than in non-DCs (NDC). Numbers in parentheses indicate number of areas counted. *P < 0.05 and **P < 0.01, Tukey’s test. (f) The number of CD11c+ dendritic cells in the exocrine pancreas tends to decrease in some cases with duration of SPIDDM exceeding 10 years. (g) The number of CD8+ T cells in the exocrine pancreas of SPIDDM is negatively associated with SPIDDM pancreas weight. P = 0.035 by Pearson’s correlation coefficient. (h) The number of CD68+ macrophages in the exocrine pancreas of SPIDDM does not correlate with SPIDDM pancreas weight. (i) The PanIN area in SPIDDM pancreas correlates negatively with pancreatic weight. P = 0.036 by Pearson’s correlation coefficient. (j) The fibrosis area of SPIDDM correlates negatively with SPIDDM pancreas weight. P < 0.05 by Pearson’s correlation coefficient.

