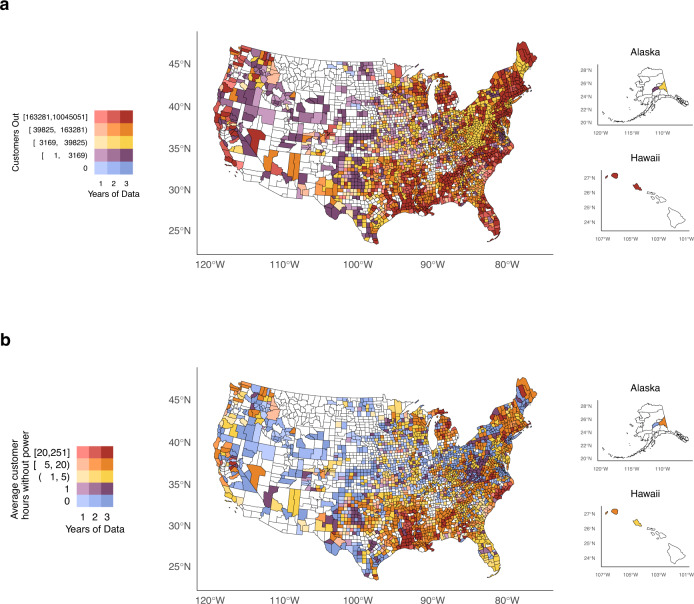
Fig. 4. County yearly averages of customers without power.
Counties shaded in white lacked any reliable data. a Average total customer hours without power. b Average total customer hours without power per customer. Panel b can be interpreted as the county-level annual average hours without power that an average customer in that county experienced. Power outage data was purchased from PowerOutage.us and county basemaps were obtained from the usmap R package version 0.6.1.

