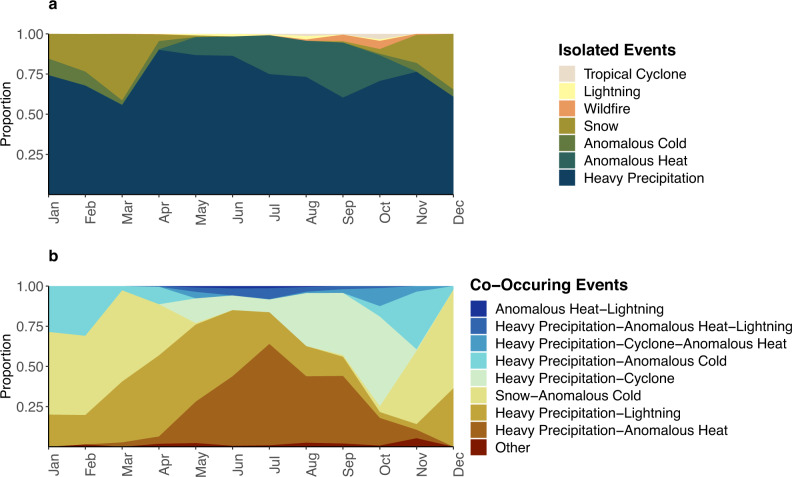
Fig. 5. Monthly distribution of severe weather or climate events on days they co-occurred with 8 + hour outages among counties with 3 years of data.
a Isolated severe weather and climate events (n = 11,310 county-days). b Multiple severe weather and climate event combinations (n = 2,846 county-days). An isolated event was a county-day where only a single severe weather or climate event occurred and multiple events were county-days where more than one event occurred. We defined a county exposed to lightning if a lightning flash happened, tropical cyclone if the county was within 100 km of a cyclone path, wildfire if the county intersects a km2 wildfire, anomalous heat if temperatures exceed 24 °C and that is above the 85th percentile, anomalous cold if temperatures are below 0 °C and below the 15th percentile, snowfall if snow accumulation > 1 inch, and heavy precipitation if precipitation > 85th percentile. Power outage data was purchased from PowerOutage.us.

