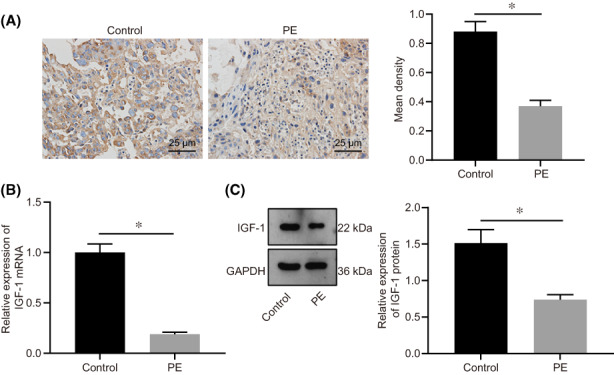
FIGURE 1.

IGF‐1 was downregulated in the PE group. A, The expression of IGF‐1 in placental tissues of PE and NP determined by IHC (n = 18). B, IGF‐1 RNA expression in PE group measured by RT‐qPCR (n = 18). C, Protein expression of IGF‐1 in PE measured by Western blot analysis (n = 18), grey analysis was performed using Image J software. Data were all measurement data and expressed as mean ± standard deviation. The independent t‐test was employed for comparison between the two groups. * p < 0.05 compared with the NP group. IGF‐1, insulin‐like growth factor 1; PE, pre‐eclampsia; NP, normal pregnancy; RT‐qPCR, reverse transcription‐quantitative polymerase chain reaction; IHC, immunohistochemistry; n, number
