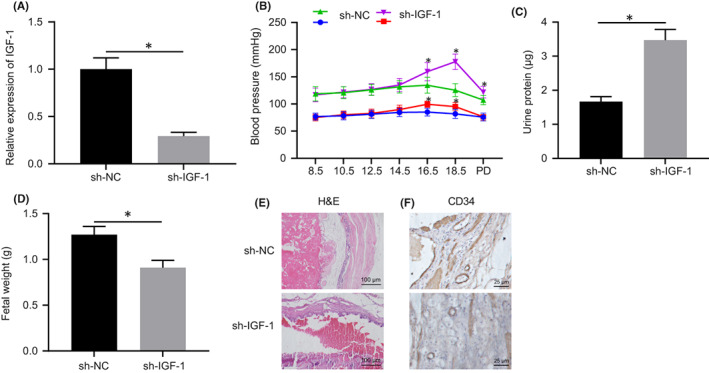
FIGURE 6.

Silencing of IGF‐1 induces PE pathogenesis. A, The expression of IGF‐1 after transfection of sh‐IGF‐1 determined by RT‐qPCR. B, Systolic blood pressure and diastolic blood pressure in cells transfected with sh‐IGF‐1 group or sh‐NC at embryonic days E0, E8.5, E10.5, E12.5, E14.5, E16.5 and E18.5. C, Urine protein content in cells transfected with sh‐IGF‐1 of mice at E18.5. D, Weight of mice embryo. E, The structure of the placenta observed by HE staining (20 ×). F, The structure of the placenta observed by CD34 staining (20 ×). Data were measurement data and expressed as mean ± standard deviation. An independent t‐test was used for comparison between two groups. * p < 0.05 vs. that of cells transfected with sh‐NC. The cell experiment was repeated three times. HE, haematoxylin–eosin
