Figure 1.
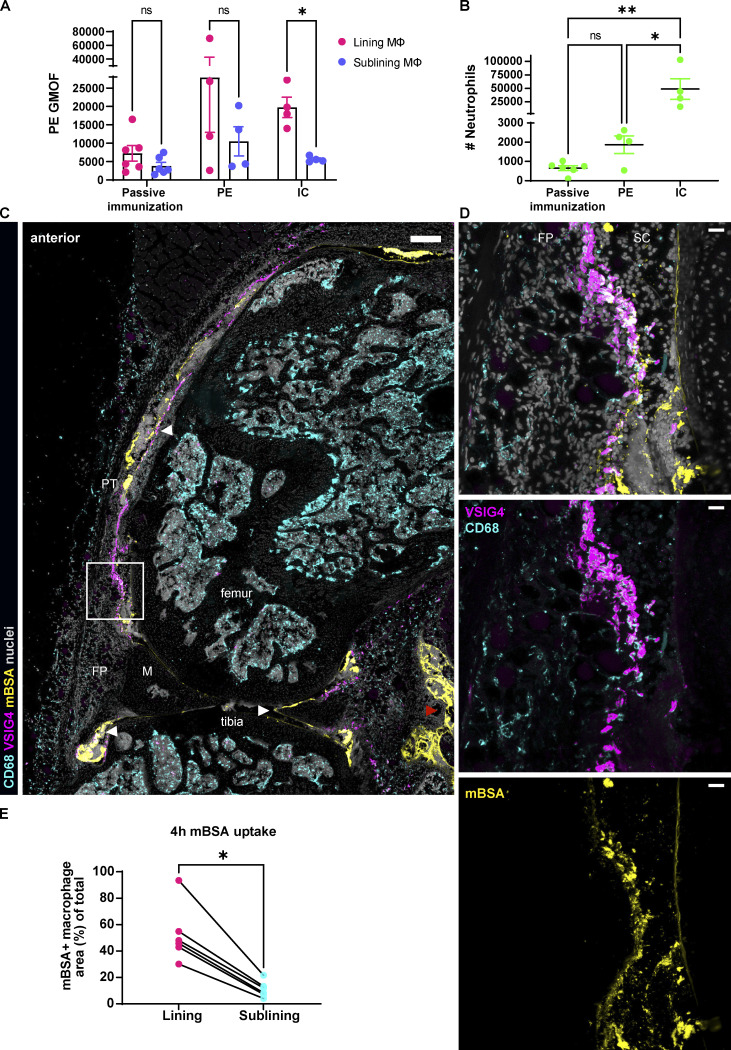
Lining macrophages phagocytose ICs and model antigen-mBSA. (A) Quantification of PE fluorescence intensity by FACS in synovial resident macrophages 3 h after IA injections. Significance values by mixed-effects analysis with Šídák multiple comparisons post hoc: *, P < 0.05. GMOF, geometric mean of fluorescence. (B) Synovial neutrophil counts as a result of IC and PE challenge by FACS at 3 h after IA injections. Significance values by one-way ANOVA with Šídák multiple comparisons post hoc: *, P < 0.05; **, P < 0.01; data representative of two experiments. (C) Confocal fluorescence microscopy of the whole mouse knee in sagittal plane 4 h after injection of fluorescently labeled mBSA (large panel with white arrowheads pointing out lining and cartilage localization of the antigen, whereas red arrowhead indicates leak in the posterior part; pan-macrophage CD68, cyan; lining macrophage VSIG4, magenta; mBSA, yellow; nuclei, gray; colocalization of VSIG4 and mBSA, white; scale bar = 100 µm). (D) Zoomed region of the lining shows preferential uptake of mBSA by the lining macrophages and not the sublining ones (three right panels, scale bar = 20 µm). (E) Quantification of mBSA uptake by the lining and sublining macrophages (N = 2; n = 6) in a scatter plot; each symbol indicates one section, and lines connect macrophages of the same section. N indicates the number of mice, n the number of quantified sections; data representative of two independent experiments. Significance values by Wilcoxon matched-pairs signed rank test: *, P < 0.05. FP, fat pad; M, meniscus; PT, patellar tendon; SC, synovial cavity.

