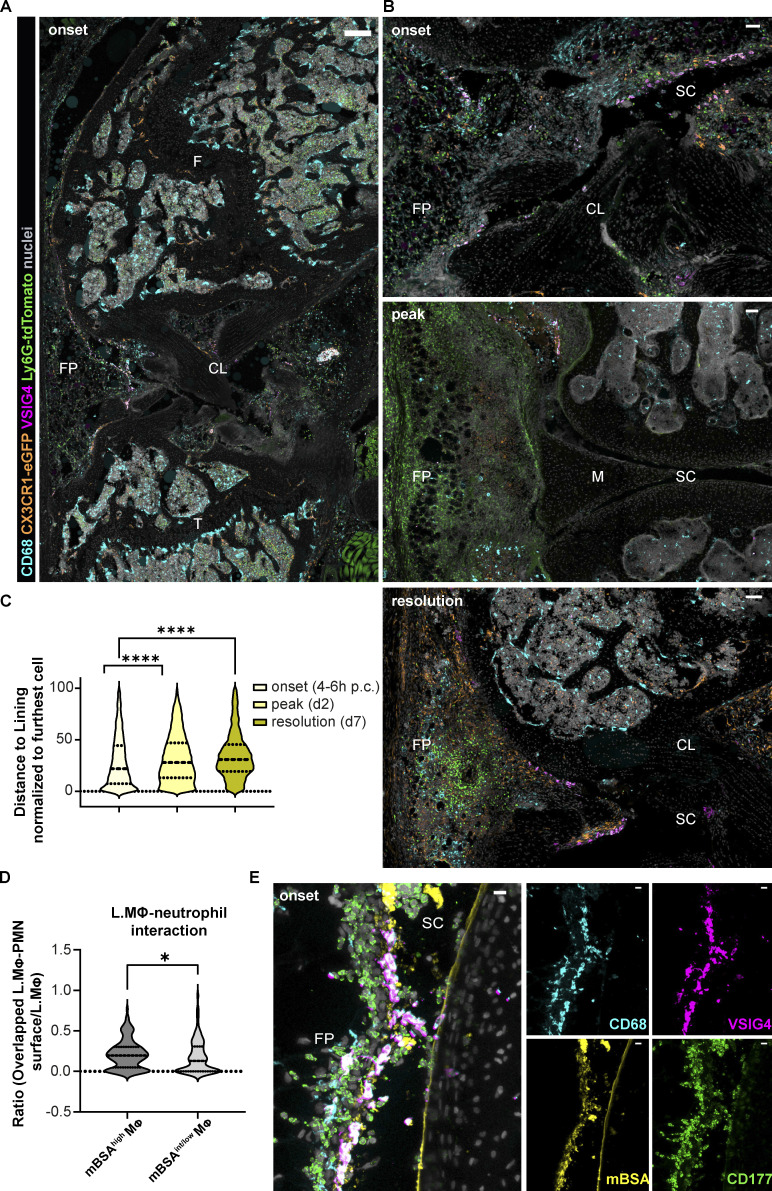
Figure 3.
Topography of recruited neutrophils during AIA: Onset-specific clustering in the synovial lining and interaction with mBSA-laden lining macrophages. (A and B) Confocal images of murine synovia during AIA in CX3CR1-eGFP Ly6G-tdTomato double reporter mice show that neutrophils cluster in the synovial lining niche at the onset: 6 h large overview (A) and 4 h anterior synovium ROI (B) have uniform distribution at day 2 (peak of inflammation, middle panel) and form localized swarms at day 7 (resolution of inflammation, bottom panel). CD68, cyan; CX3CR1, orange; VSIG4, magenta; Ly6G-tdTomato, green; nuclei, gray; scale bar = 300 and 50 µm in the entire mouse knee cross-section and ROIs, respectively. (C) Respective quantification of neutrophil position within the anterior synovium of the whole knee cross-sections as in A: neutrophil distance to the lining at the onset (6 h), peak (day 2), and resolution (day 7) of AIA presented in violin plots. Each violin plot represents three mice combined with two to three sections at different positions in the knee quantified, median and interquartile range indicated. Total quantifications: N = 3; n = 2–3; N indicates mouse group size, n the number of sections per mouse; samples from four independent experiments. P values by Kolmogorov–Smirnov comparison: ****, P < 0.0001. CL, cruciate ligaments; F, femur; FP, fat pad; M, meniscus; SC, synovial cavity. (D) Lining macrophages (L.MΦ) exhibiting higher mBSA uptake interact with more neutrophils (PMN) compared with the macrophages with lower mBSA uptake (whole anterior lining quantified on two different sections of a single mouse at 4 h p.c.; P value by Wilcoxon rank–sum test: *, P < 0.05). (E) Confocal image of the anterior synovium 4 h after injection of fluorescently labeled mBSA shows recruited neutrophils interacting with mBSA-laden lining macrophages (CD68, cyan; VSIG4, magenta; mBSA, yellow; neutrophil CD177, green; colocalization of VSIG4 and mBSA, white; scale bar = 10 µm). FP, fat pad; SC, synovial cavity.

