Figure 4.
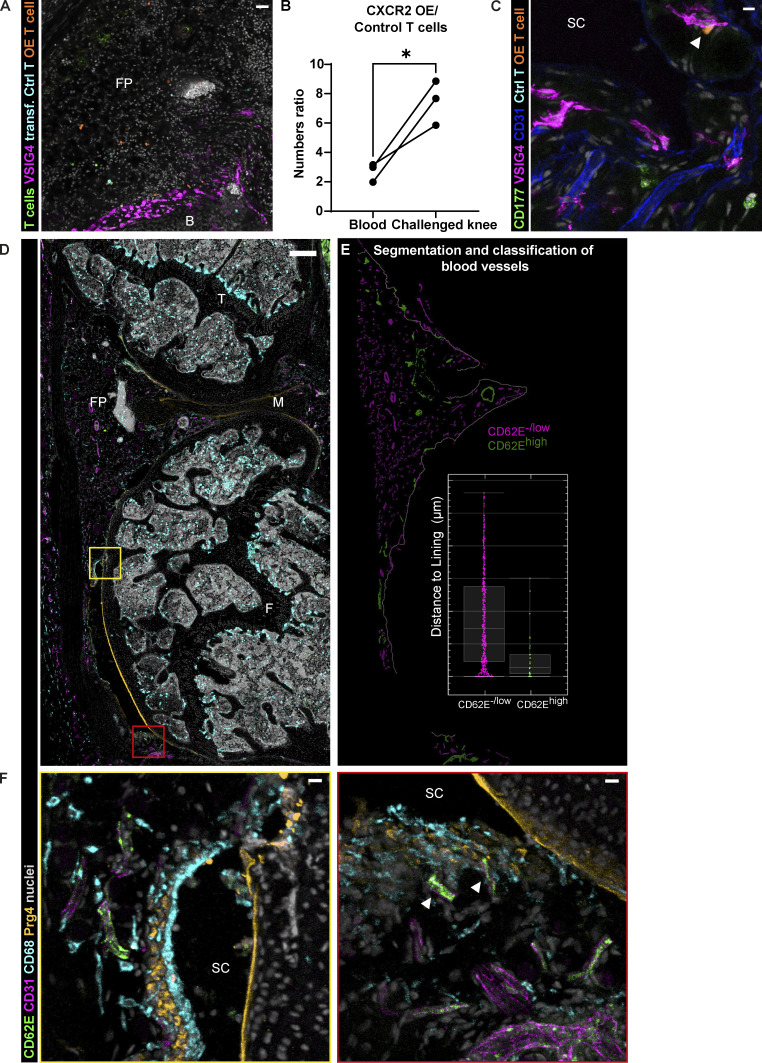
Activation of microvasculature in the synovial lining niche at the onset of AIA. (A) Representative confocal image of the synovium demonstrating higher number of transferred CXCR2 OE T cells compared with the control T cells and the closer proximity of OE T cells to the lining (CD4+; CD8+ T cells, green; VSIG4, magenta; control T cells, cyan; CXCR2 OE T cells, orange; nuclei, gray; scale bar = 30 µm); single experiment with two animals. (B) Numbers ratio of CXCR2 OE T cells to control T cells measured by FACS in the blood and the synovium of mice 6 h p.c. (5 h after adoptive T cell transfer) shows preferential recruitment of CXCR2 OE T cells to the synovium. Significance value by paired t test: *, P < 0.05. Experiment performed two times. (C) CXCR2 OE T cells in the synovial cavity interacting with the lining macrophage (CD177, green; VSIG4, magenta; CD31, blue; control T cells, cyan; CXCR2 OE T cells, orange; nuclei, gray; scale bar = 10 µm). (D) Confocal image of the whole mouse knee cross-section immunostained for endothelial activation marker E-selectin (CD62E) reveals distinct position of activated vasculature close to the lining (CD62E, green; CD31, magenta; CD68, cyan; lining fibroblast Prg4, orange; nuclei, gray; scale bar = 200 µm). (E) Segmentation of the vasculature in the anterior synovium of the image in A using Imaris to classify highly activated (CD62Ehigh) and non-activated (CD62E−/low) blood vessels. Inset shows representative distribution of activated microvasculature in regards to the synovial lining of the image mask in E; each point is one blood vessel surface of the respective image; median and interquartile range indicated. (F) Enlarged region of the synovial lining with CD62Ehigh blood vessel is shown in the left panel, whereas the right panel shows patellar region with CD62Ehigh blood vessels in direct contact with lining macrophages (arrowheads), as well as an activated larger-diameter blood vessel situated a few cell layers deeper (scale bar = 20 µm). B, bone; F, femur; FP, fat pad; M, meniscus; SC, synovial cavity; T, tibia. Images and quantification representative of four animals from two independent experiments.

