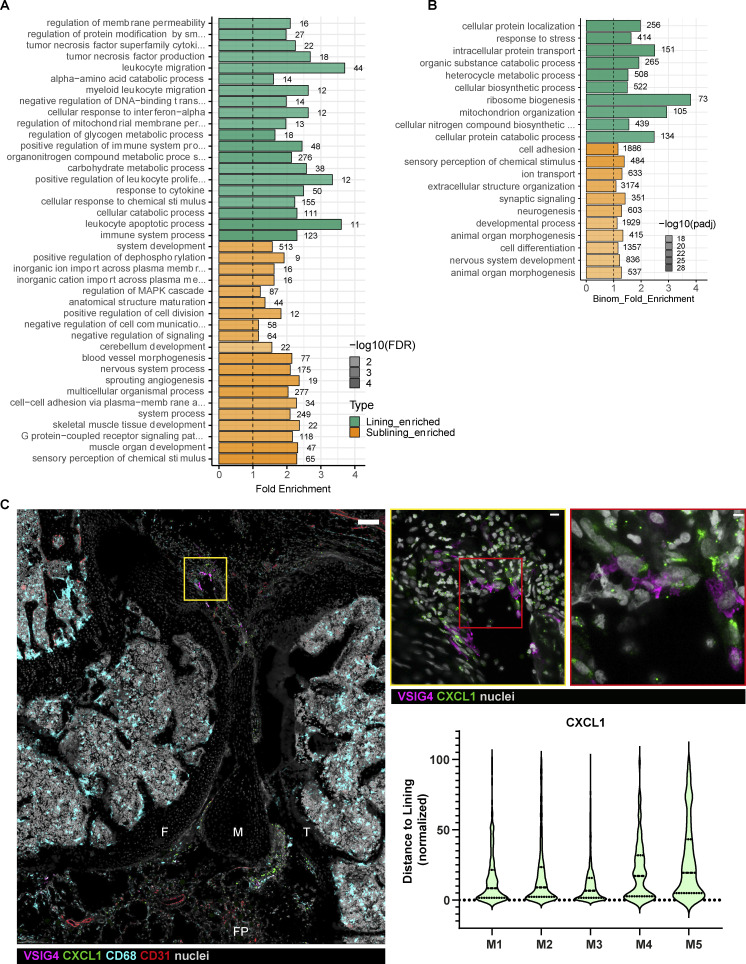
Figure S2.
Activated transcriptional profile in lining macrophages at the onset of AIA and CXCL1 expression in the lining. (A) GO analysis of differentially expressed genes in lining and sublining macrophages at 4 h after mBSA challenge (n = 3). FDR, false discovery rate. (B) GO analysis of differentially expressed genes in lining and sublining macrophages from PBS control knees (n = 3). (C) Confocal images of the knee immunostained for CXCL1 at 4 h p.c. (large panel; VSIG4, magenta; CXCL1, green; CD68, cyan; CD31, red; nuclei, gray; scale bar = 100 µm). Zoomed region of the lining shows expression of CXCL1 in various cells (middle panel, scale bar = 10 µm), whereas further enlargement demonstrates colocalization of CXCL1 and VSIG4 (right panel, scale bar = 3 µm). (D) Quantification of CXCL1 distribution in the synovium in additional mice from two independent experiments; Each violin plot represents one to two knee sections of a single mouse with median and interquartile range indicated. F, femur; FP, fat pad; M, meniscus; T, tibia.

