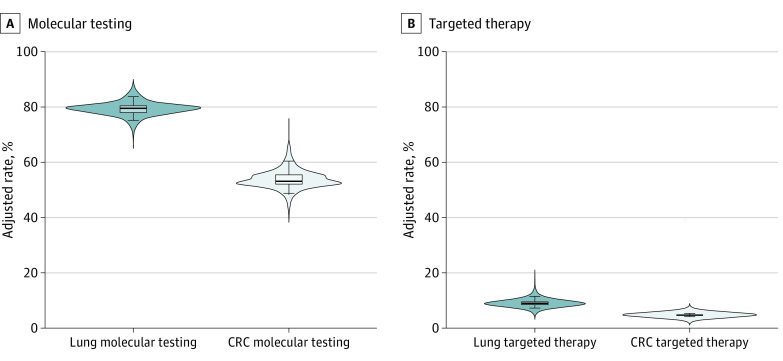
Figure 3. Probability Density Plots Showing Variation in Adjusted Rates for Molecular Testing and First-line Targeted Therapy Use by Practice.
The superimposed box and whisker plots display the median (center line), interquartile range (edges of boxes), and the 5th and 95th percentiles (whiskers) of adjusted rates. CRC indicates colorectal cancer.

