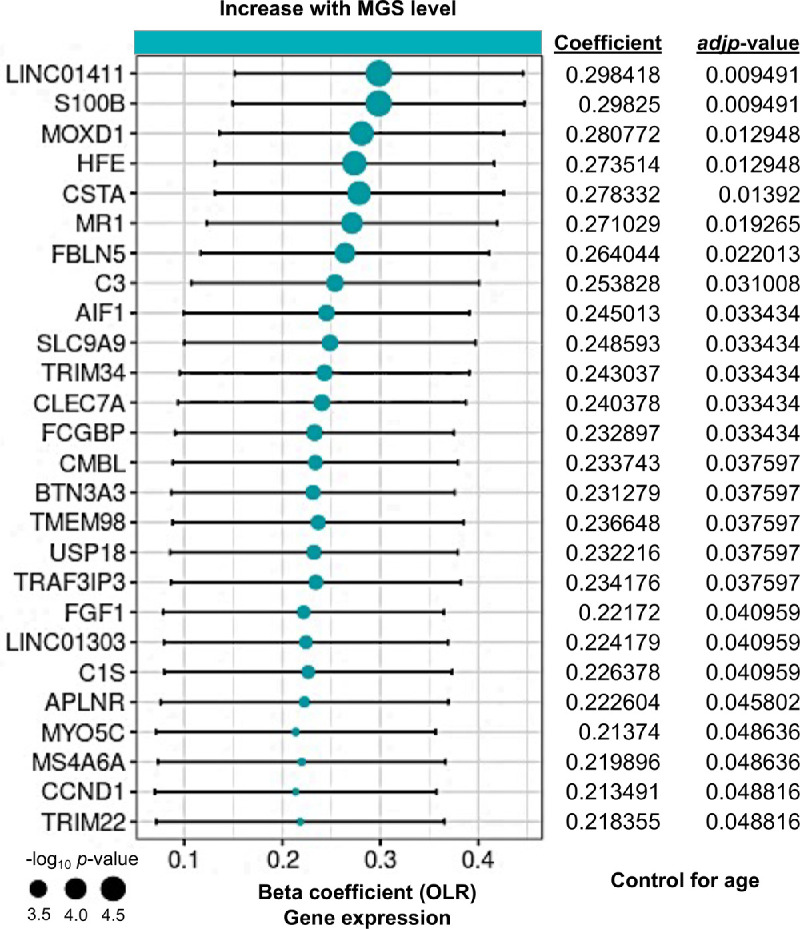
Figure 2.

Identification of age-associated genes progressively increased with AMD severity (MGS level). Forest plot of age-associated gene having significant correlation with MGS level (age-MGS genes, n = 26, adjusted P < 0.05). Positive coefficients indicate age-associated genes increase in expression with MGS level. We focused the genes with increased expression over MGS level and defined them. Statistical analyses of MGS association for age-up genes were assessed by a nonparametric ordinal logistic regression model that controls for age. Point sizes are scaled by statistical significance. Error bars represent 95% confidence intervals.
