
Figure 3.
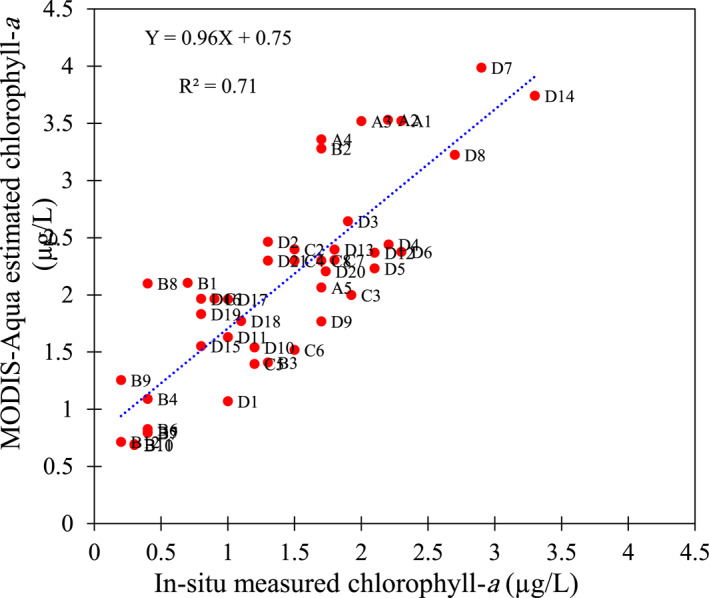
Scatter plot of the MODIS‐Aqua estimated chlorophyll‐a data versus those measured in situ in south Caspian Sea. A1–A5: The measured and the MODIS‐Aqua estimated Chl‐a data in 2009, B1–B12: The measured and the MODIS‐Aqua estimated Chl‐a data in 2012, C1–C8: The measured and the MODIS‐Aqua estimated Chl‐a data in 2018, and D1–D21: The measured and the MODIS‐Aqua estimated Chl‐a data in 2019. Geographical location of the sampling points A1–A5, B1–B12, C1–C8, and D1–D21 are shown in Figure 1a.