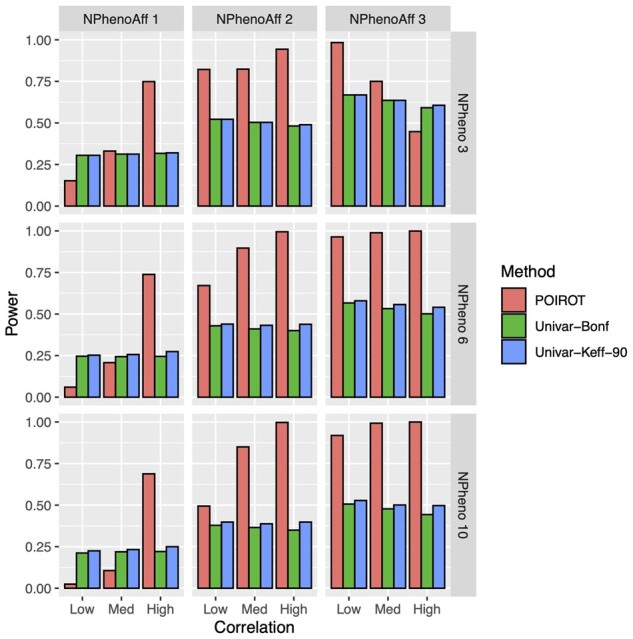
Figure 3.

Power of POIROT to identify POEs assuming K = 3, 6, or 10 normal phenotypes (horizontal panels) compared to univariate test. We assume either 1, 2, or 3 of the phenotypes harbor POEs at the locus (vertical panels). We performed 5000 simulations for each scenario. We calculated power at significance level 0.0005 for our multitrait test and 0.0005/K (Bonferroni correction) and 0.0005/Keff for the univariate test, where Keff is the number of PCs needed to explain 90% phenotypic variation. for POE traits, MAF = 0.25, and sample size = 5000. POE, parent-of-origin effect; MAF, minor allele frequency; PCs, principal components.
