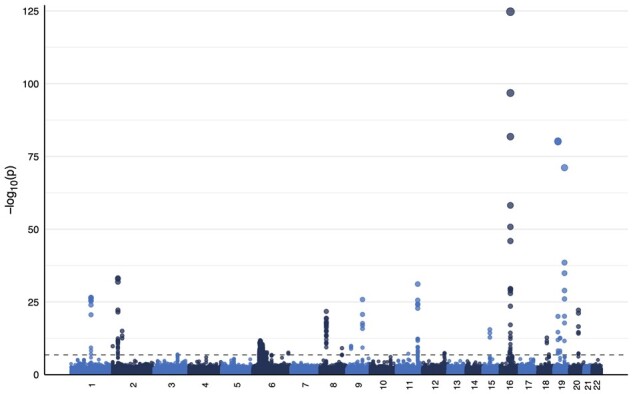
Figure 4.

Manhattan plot of parent-of-origin effects analysis using POIROT with BMI, HDL cholesterol, and LDL cholesterol phenotypes from the UK Biobank. The dashed line represents Bonferroni-adjusted genome-wide significance of 1.5 × 10⁻⁷. BMI, body mass index; HDL, high-density lipoprotein, LDL; low-density lipoprotein.
