Figure 2.
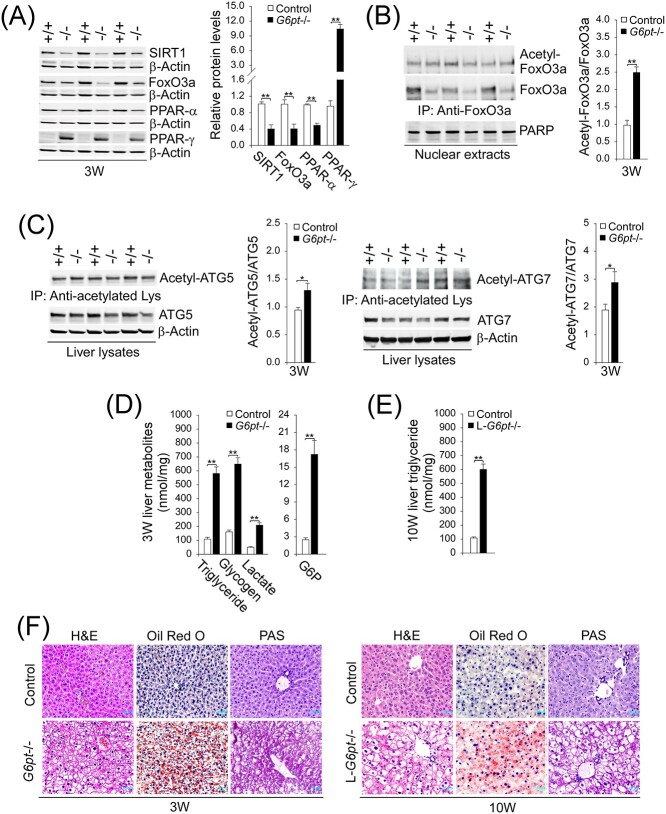
Hepatic SIRT1-FoxO3a signaling in G6pt−/− mice and phenotype analysis. Experiments were conducted using 3-week-old (3 W) control (+/+; n = 6–8) and G6pt−/− (−/−; n = 6–8) mice or 10-week-old (10 W) control (n = 8) and L-G6pt−/− (n = 8) mice. (A) Western-blot analyses of hepatic SIRT1, FoxO3a, PPAR-α, PPAR-γ and β-actin. Three sets of representative immune-stained lanes for control and G6pt−/− mice are shown for each protein. Densitometric quantification was performed and normalized against β-actin. (B) Quantification of the ratios of acetylated FoxO3a to total FoxO3a. Liver nuclear extracts from 3 W control and G6pt−/− mice (n = 6 for each group) were subjected to immunoprecipitation with an antibody against FoxO3a and the resulting precipitates analyzed by western blot using an antibody against either the acetylated lysine or FoxO3a. (C) Quantification of the ratios of acetylated ATG5 or ATG7 to total ATG5 or ATG7. Liver extracts from 3 W control and G6pt−/− mice (n = 6 for each group) were subjected to immunoprecipitation with an antibody against acetylated lysine and the resulting precipitates analyzed by western blot using an antibody against either ATG5 or ATG7. (D) Hepatic triglyceride, glycogen, lactate and G6P levels in 3 W control and G6pt−/− mice. (E) Hepatic triglyceride levels in 10 W control and L-G6pt−/− mice. (F) H&E, Oil Red O and PAS staining of the livers in 3 W control and G6pt−/− mice or 10 W control and L-G6pt−/− mice. Scale bar, 20 μm. Values represent the mean ± SEM. *P < 0.05, **P < 0.01.

