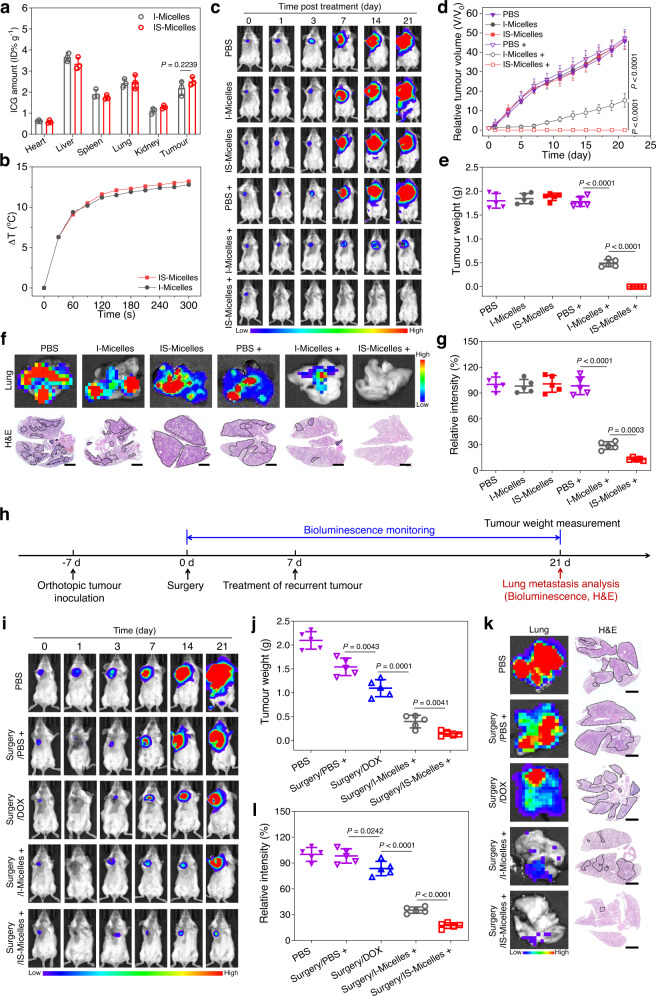
Fig. 4. TRPV1 blockade-synergized thermotherapy effectively suppresses primary, metastatic and recurrent TNBC tumors using IS-Micelles.
a Biodistribution of I-Micelles and IS-Micelles in orthotopic 4T1-Luc tumors at 24 h post-injection (n = 3 mice per group). b Temperature elevation at tumor site of mice bearing orthotopic 4T1-Luc tumors at 24 h post-injection of I-Micelles or IS-Micelles under light irradiation. Bioluminescence images (c), relative tumor volumes (d) and tumor weights (e) of the mice bearing orthotopic 4T1-Luc tumors treated with IS-Micelles or I-Micelles under light irradiation (+) or not during 21 days (n = 5 mice per group, color bar, Low represents 1000 a.u. and High represents 30000 a.u.). Bioluminescence images (up), H&E images (down) (f) and relative bioluminescence intensities (g) of the lung metastasis from the mice bearing orthotopic 4T1-Luc tumors at the end of the experiment as indicated in c (n = 5 mice per group, color bar, Low represents 100 a.u. and High represents 800 a.u.). Areas marked by black dash lines indicate the metastatic regions. Scale bars, 2 mm. h Timeline for the treatment of recurrent TNBC tumor models suffering from surgical failure. Bioluminescence images (i) and tumor weights (j) of the mice bearing orthotopic 4T1-Luc breast tumors treated with initial surgery, followed by subsequent treatments with IS-Micelles under light irradiation (+), I-Micelles under light irradiation (+) and DOX, respectively (n = 5 mice per group, color bar, Low represents 1000 a.u. and High represents 30000 a.u.). Bioluminescence images (left), H&E images (right) (k) and relative bioluminescence intensities (l) of the lung metastasis from the mice at the end of the experiment as indicated in i (n = 5 mice per group, color bar, Low represents 100 a.u. and High represents 800 a.u.). Areas marked by black dash lines indicate the metastatic regions. Scale bars, 2 mm. Data are presented as mean ± SD (a, d, e, g, j, l). Statistical significance was determined by one-way ANOVA with Tukey’s post hoc test. Source data are provided as a Source Data file.

