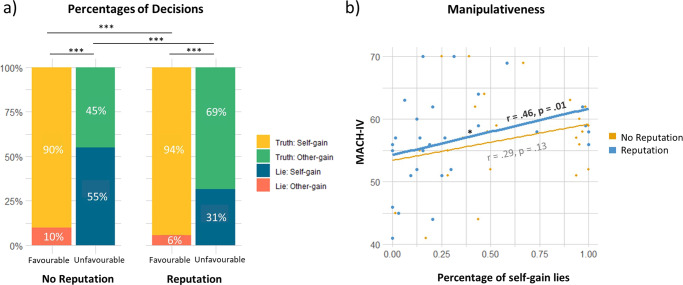
Fig. 1. Decision-making percentages and correlations with levels of manipulative traits.
a Percentages of decisions for each reputation condition (No Rep or Rep) and within each outcome (Fav or UnFav) (N = 28). b Correlation graph of individuals’ Machiavellian scores with the percentages of self-gain lies during no reputation risk (yellow) and reputation risk (blue) conditions (N = 28). The line plot in bold depicts significance. MACH-IV Machiavellian questionnaire scores.

