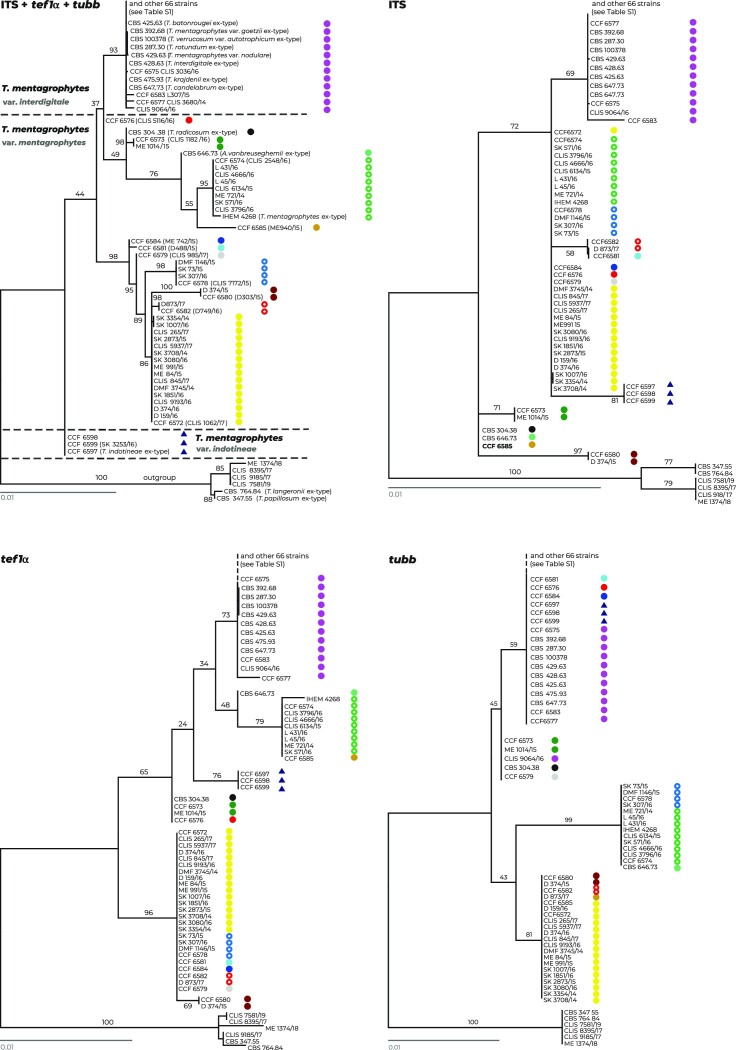
Figure 1.
A comparison of the combined phylogeny based on three loci, ITS rDNA, tef1-α, and tubb (upper left tree), with single-gene phylogenies based on individual loci. All trees represent the best scoring maximum likelihood trees constructed in IQ-Tree. The alignment characteristics, partitioning scheme, and substitution models are listed in Supplementary Table S2. Strains with similar haplotypes/from the same clade are designated with colored shapes to highlight their different or similar position and clustering across trees. The clade containing isolates belonging to the T. simii complex is used as the outgroup.

