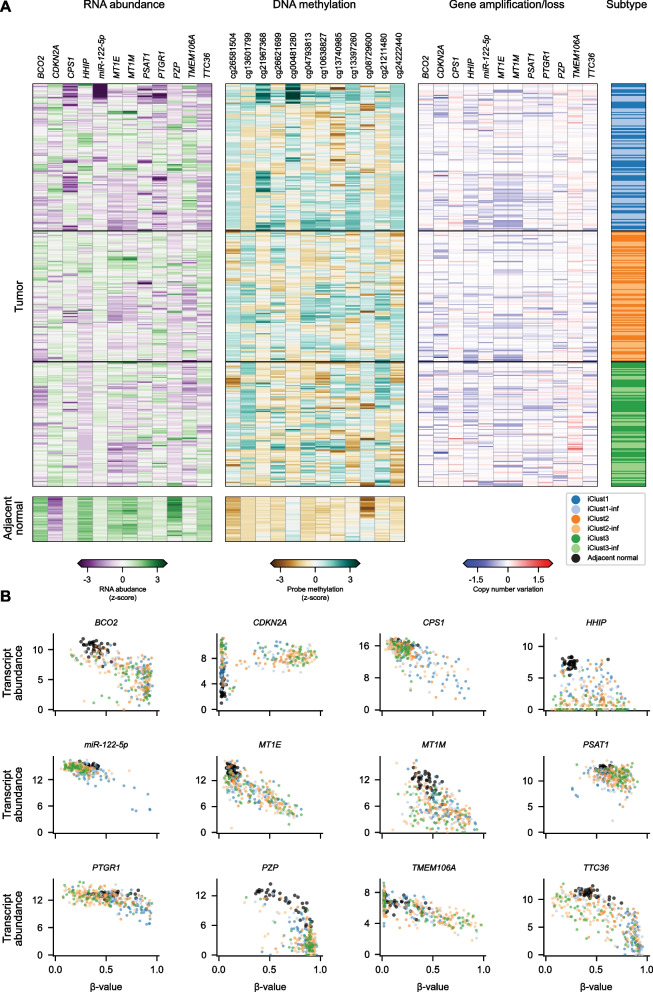
Fig. 1.
A 12-tumor suppressor gene panel from TCGA hepatocellular carcinoma patients shows gene silencing through promoter DNA methylation within subsets of liver cancer samples. A RNA transcript abundance (logTPM, z-score normalized), methylation of promoter-associated probes (β-value, z-score normalized), and copy number variation for the indicated genes (left to right), together with tumor sample “integrated-data cluster” (iClust) annotations. RNA abundance and DNA methylation are also shown for matched normal liver tissue samples where available. B Scatter plots showing the association between RNA transcript abundance (y-axis; logTPM) and associated probe-level of promoter DNAme (x-axis; β-value). Scatter markers colors correspond to adjacent normal liver (black), iClust1 (blue), iClust1-inf (light blue), iClust2 (orange), iClust2-inf (light orange), iClust3 (green), or iClust3-inf (light green) tumor samples. Further information on inferred iClusters (iClust-inf) is given in “Methods”

