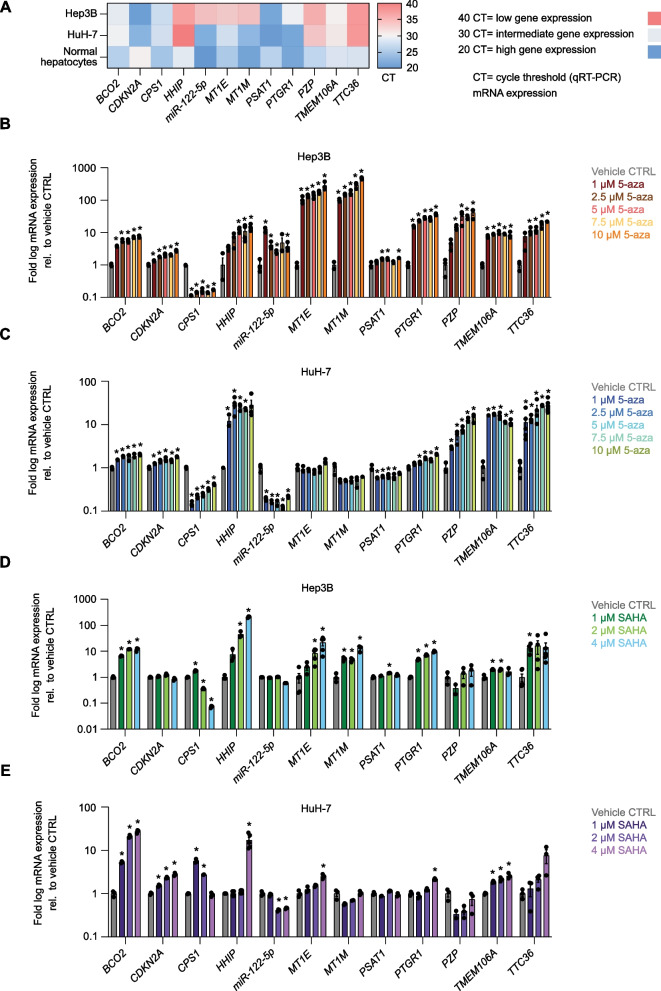
Fig. 2.
Epi-drugs reactivate a subset of tumor suppressor genes in Hep3B and HuH-7 HCC cell lines. A Heatmap of the 12-tumor suppressor gene (TSG) panel comparing the mRNA expression in Hep3B and HuH-7 HCC cell lines versus normal hepatocytes. Gene expression was evaluated by qRT-PCR. Red color indicates the least expressed (cycle threshold 40) and blue color the highest expressed (cycle threshold 20) genes. Data are means (n = 3). B, C Transcriptional regulation of the 12-TSG panel 72 h after 5-aza treatment at different concentrations, indicated by color, in Hep3B and HuH-7 cells, respectively. The data show the fold log10 change in TSG mRNA levels relative to vehicle-treated cells. From left to right, for Hep3B cells: BCO2: *P = 0.000017, 0.000189, 0.000237, 0.000041, 0.000036; CDKN2A: *P = 0.001726, 0.000067, 0.000965, 0.000064, 0.000066; CPS1: *P = 0.000004, 0.000004, 0.000009, 0.000004, 0.000005; HHIP: *P = 0.001481, 0.032448, 0.003285; miR-122-5p: *P = 0.000884, 0.009364, 0.009338, 0.021386; MT1E: *P = 0.013894, 0.000860, 0.008483, 0.001014, 0.021049; MT1M: *P = 0.001025, 0.000295, 0.004843, 0.007027, 0.000230; PSAT1: *P = 0.011710, 0.020228, 0.004350; PTGR1: *P = 0.000021, 0.000004, 0.000007, 0.000130, 0.000010; PZP: *P = 0.000595, 0.018607, 0.000256, 0.006314; TMEM106A: *P = 0.000067, 0.000002, 0.000175, < 0.000001, 0.002216; and TTC36: *P = 0.003576, 0.001630, 0.001968, < 0.000001. For HuH-7 cells: BCO2: *P = 0.000234, 0.000074, 0.009780, 0.002345, 0.000073; CDKN2A: *P = 0.002474, 0.002569, 0.004410, 0.001787, 0.000041; CPS1: *P = 0.000012, 0.000018, 0.000023, 0.000031, 0.000052; HHIP: *P = 0.011967, 0.008680, 0.000309, 0.000009; miR-122-5p: *P = 0.002266, 0.001959, 0.002015, 0.001671, 0.002592; PSAT1: *P = 0.009506, 0.012759, 0.022472, 0.020526; PTGR1: *P = 0.008993, 0.000421, 0.002261, 0.000051; PZP: *P = 0.000718, 0.012523, 0.000963, 0.000180, 0.001813; TMEM106A: *P = 0.000001, 0.000003, 0.000603, 0.000005, 0.000717; and TTC36: *P = 0.012646, 0.000005, 0.002686, < 0.000001, 0.000026. D, E Transcriptional regulation of the 12-TSG panel 48 h after SAHA treatment at different concentrations, indicated by color, in Hep3B and HuH-7 cells, respectively. The data show the fold log10 change in TSG mRNA levels relative to vehicle-treated cells. From left to right, for Hep3B cells: BCO2: *P = 0.000006, < 0.000001, 0.000511; CPS1: *P = 0.000209, 0.000020, 0.000003; HHIP: *P = 0.003836, 0.000015; MT1E: *P = 0.004923, 0.005036; MT1M: *P = 0.001981, 0.001938, 0.003620; PSAT1: *P = 0.000809; PTGR1: *P = 0.000052, 0.000013, 0.000023; TMEM106A: *P = 0.001558, 0.002973; and TTC36: *P = 0.000448. For HuH-7 cells: BCO2: *P = 0.000019, 0.000023, 0.000054; CDKN2A: *P = 0.000785, 0.000030, 0.000190; CPS1: *P = 0.000156, < 0.000001; HHIP: *P = 0.005756; miR-122-5p: *P = 0.000968, 0.001295; MT1E: *P = 0.002001; PTGR1: *P = 0.000127; and TMEM106A: *P = 0.000221, 0.001073, 0.001910. The data presented as means ± SEM (n = 3), and P values were determined by multiple unpaired t-test comparisons with a two-stage linear step-up procedure of Benjamini, Krieger, and Yekutieli

