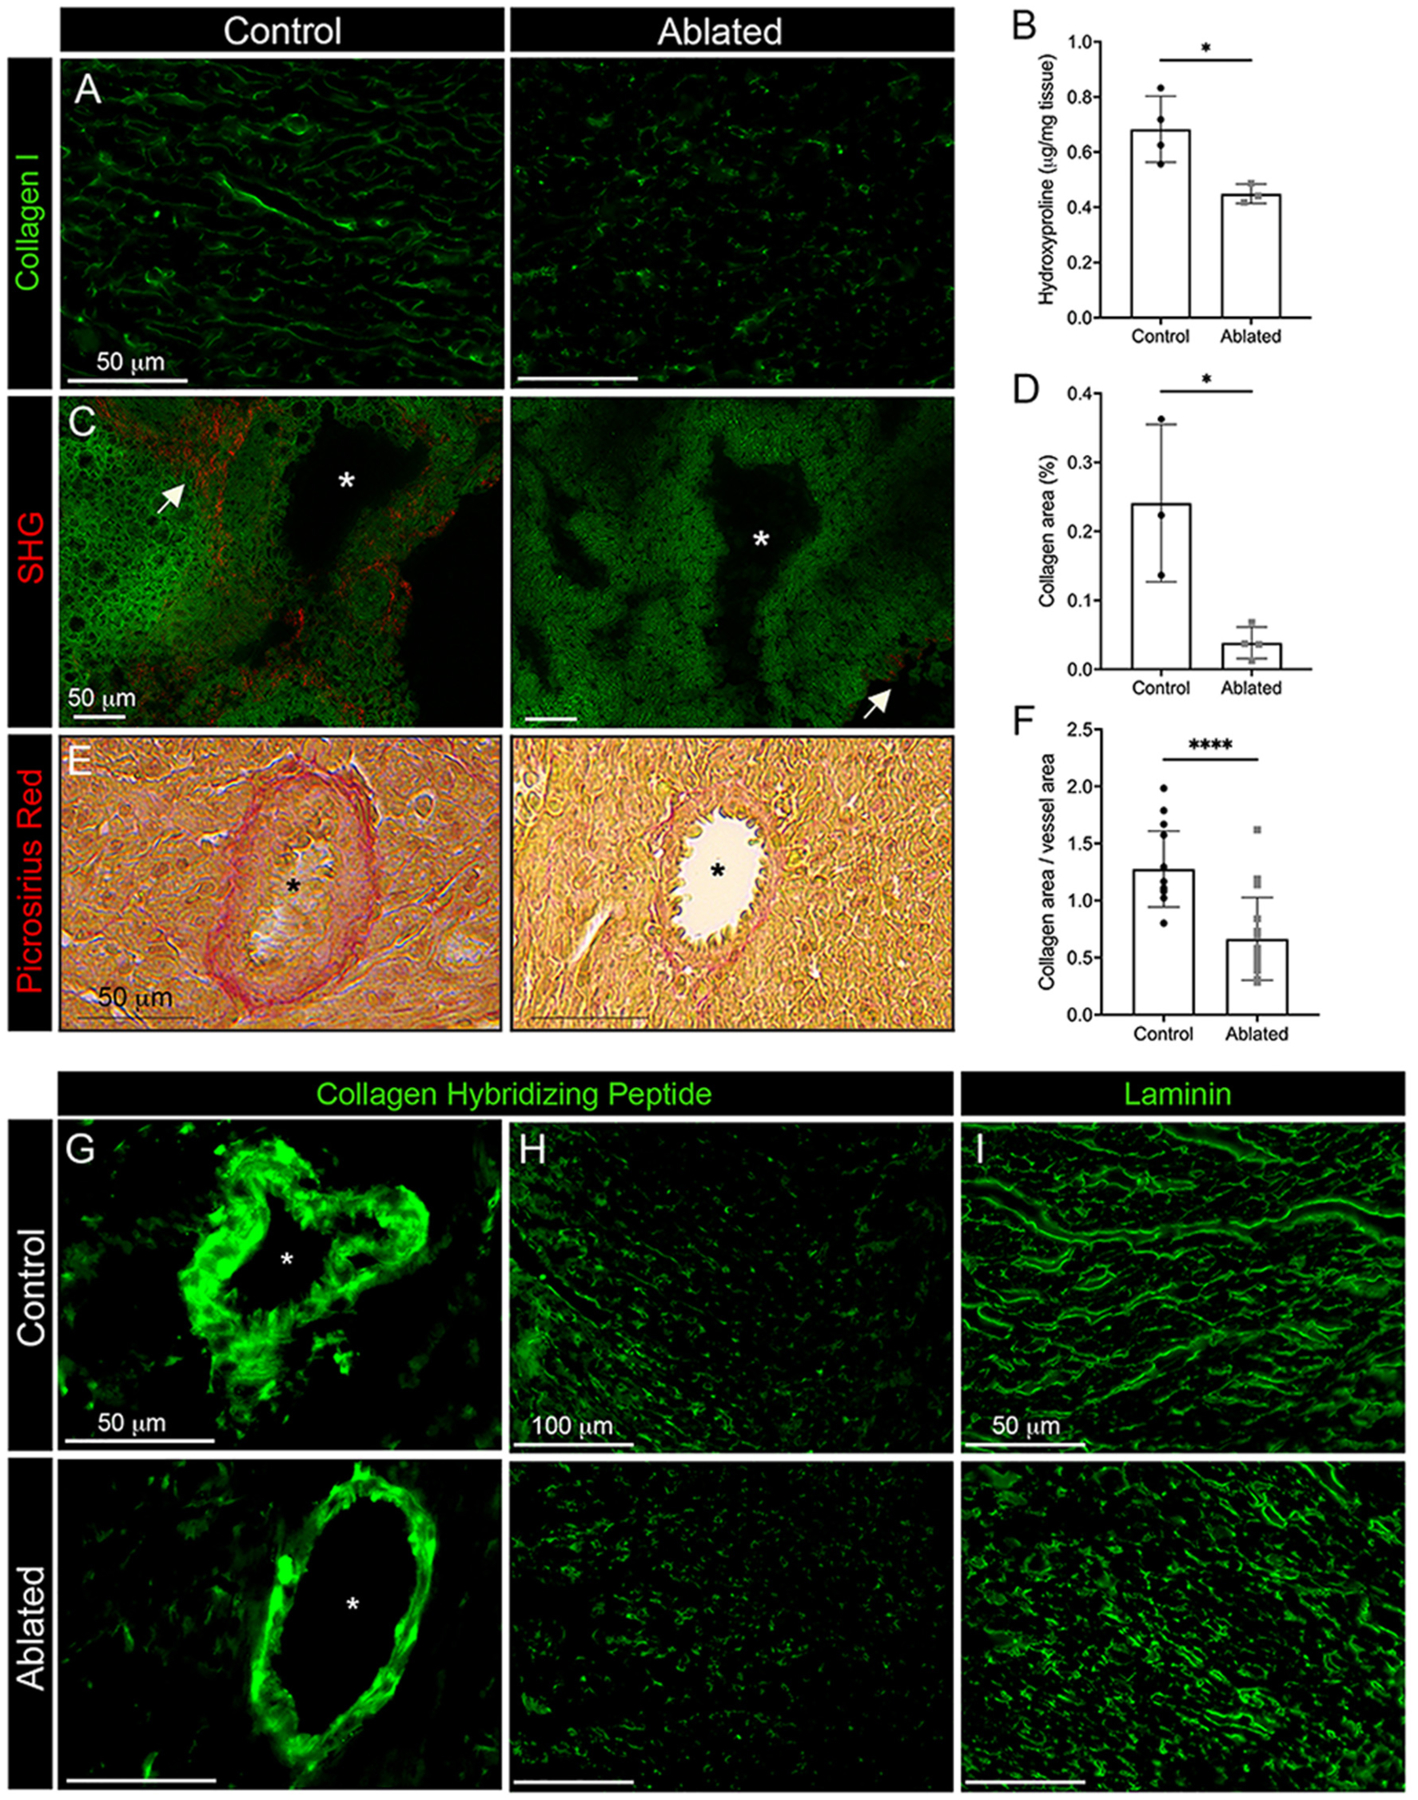
Fig. 4.

Reduced collagen deposition in fibroblast ablated hearts. Representative images of (A) collagen I immunostaining and (B) hydroxyproline content from whole ventricular tissue. Induction at P1 and isolation at P5. Control: n = 4; ablated: n = 3. (C-D) Quantification and representative images of fibrillar collagen analyzed by second harmonic generation (SHG). Induction at P1 and isolation at P4. 20 FOV per biological replicate were quantified. Control: n = 3; ablated: n = 4. (E-F) Picrosirius red staining and collagen area normalized to vessel area. Induction at P1 and isolation at P5. Control: 28 vessels across 3 biological replicates; ablated: 31 vessels across 4 biological replicates. (G-H) Representative images of collagen hybridizing peptide distribution surrounding blood vessels and within the ventricle wall, respectively, and (I) laminin immunostaining. Induction at P1 and isolation at P5. Representative from a minimum of 3 biological replicates for each staining. Asterisks indicate large blood vessels. Arrows indicate area of fibrillar collagen. Results are mean ± SD. Statistical significance was determined by unpaired t-test. *P ≤ 0.05; ****P ≤ 0.0001.
