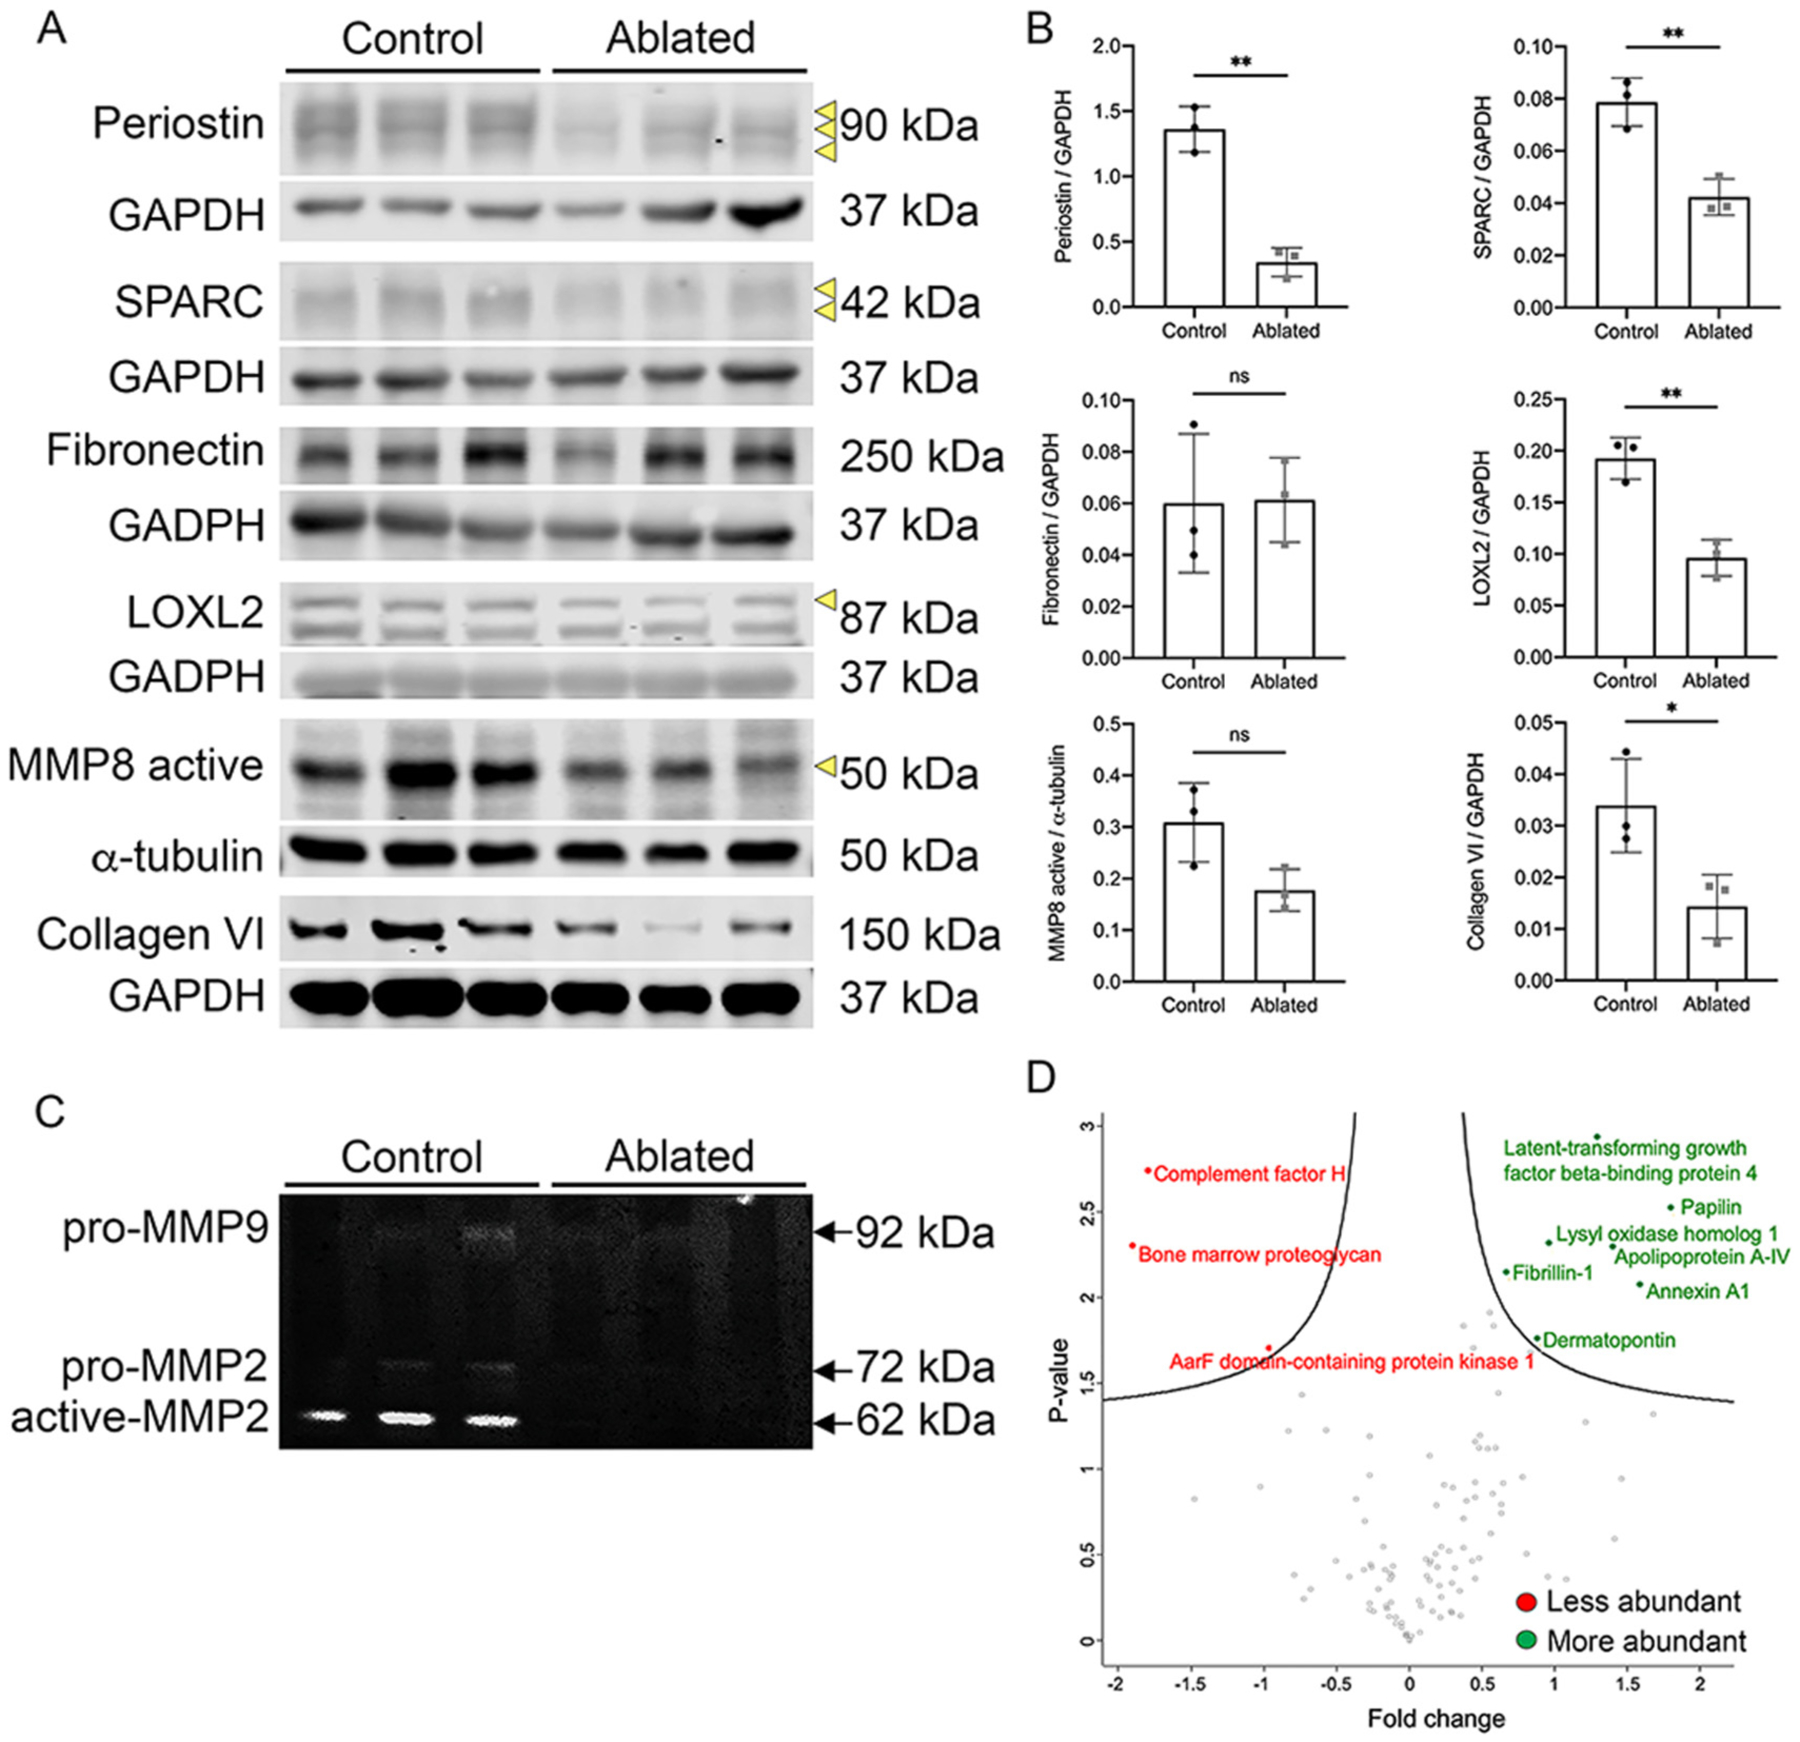
Fig. 5.

ECM changes observed with fibroblast loss. (A-B) Western blot analysis and quantification of whole ventricle lysates. Loading controls are shown below each blot. Arrows indicate protein band used for densitometry analysis. n = 3 per group. (C) Gelatin zymography of whole ventricle tissues. n = 3 per group. (D) Volcano plot of quantified proteins from decellularized control and ablated hearts. Fold change comparison is perinatal control relative to perinatal ablated. All points are FDR < 0.05. p-values are calculated from the data of three replicates. Induction at P1 and isolation at P5. Results are mean ± SD. Statistical significance was determined by unpaired t-test. ns: not significant, P > 0.05; *P ≤ 0.05; **P ≤ 0.01.
