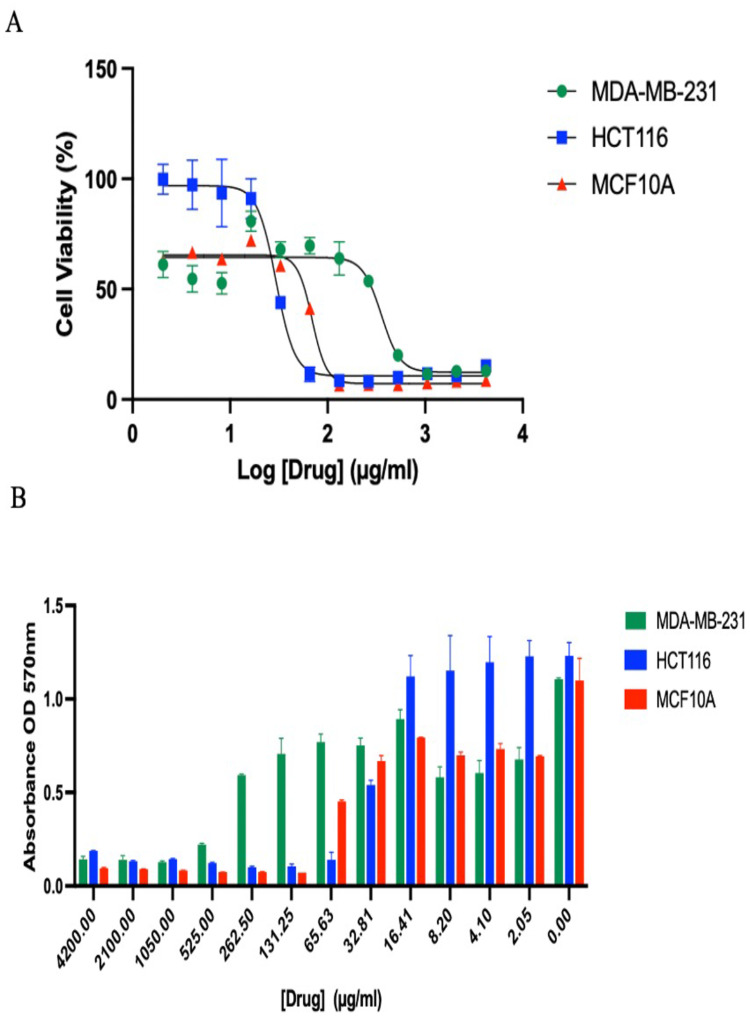
Figure 7.
(A) Dose-response showing the cytotoxic effect of M-AgNPs on the cancer cell lines; MDA MB 231, HCT116, and MCF10A. (B) Summary of the anticancer ability of M-AgNPs on HCT116, MDA MB 231, and MCF10A cells treated for 24 hrs. M-AgNPs were examined at twelve varied concentrations ranging from 2.05 to 4200 μg/mL. The histograms columns display the mean ± SD (n = 4).

