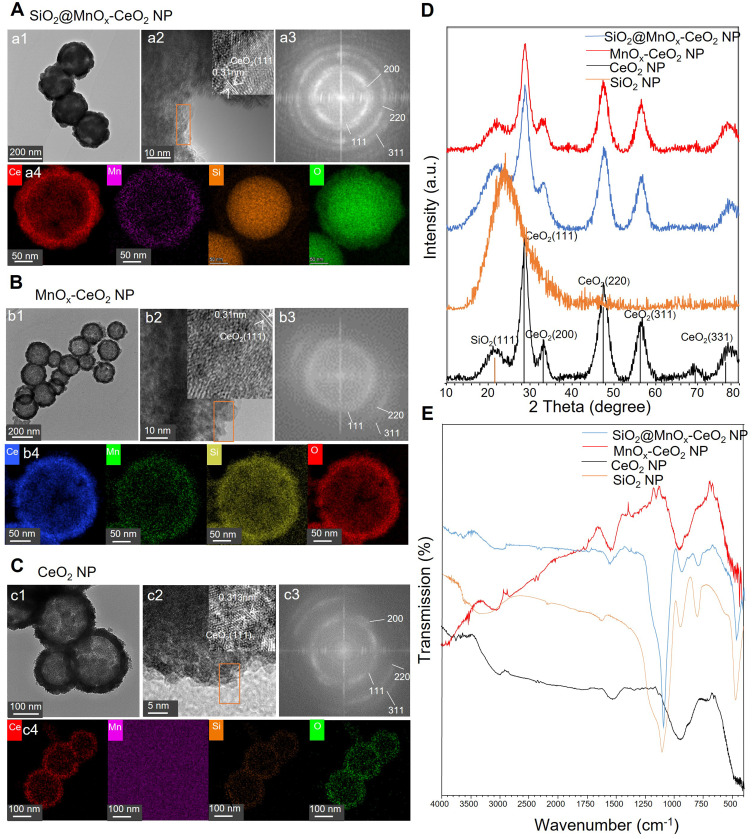
Figure 2.
Physicochemical characterization of different nanoparticles. (A) The micromorphology of SiO2@MnOx-CeO2 NPs, a1 and a2: HRTEM image, upper right was a further enlarged image of the Orange rectangle part, a3: SAED mode image, a4: energy dispersive X-ray energy spectrum image. (B) The micromorphology of MnOx-CeO2 NPs, b1 and b2: HRTEM image, upper right was a further enlarged image of the Orange rectangle part, b3: SAED mode image, b4: energy dispersive X-ray energy spectrum image. (C) The micromorphology of CeO2 NPs, c1 and c2: HRTEM image, upper right was a further enlarged image of the Orange rectangle part, c3: SAED mode image, c4: energy dispersive X-ray energy spectrum image. (D) Infrared spectrum. (E) X-ray diffraction spectrum.

