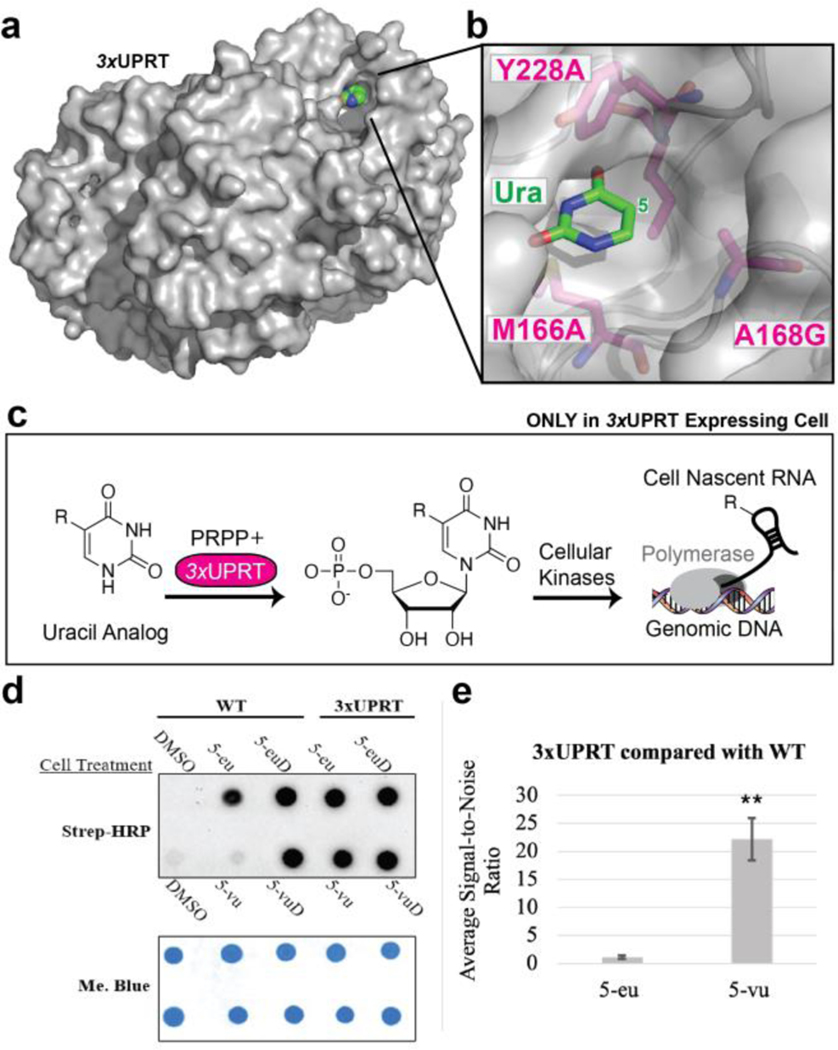
Figure 1. Characterizing cell-specific RNA metabolic labeling in MDA-MB-231 LM2 cells.
3-hour cell treatment with 1 mM of DMSO (negative control), uracil analog, or uridine analog (positive control) in WT or (+)-3xUPRT cell lines. a. Crystal structure of TgUPRT enzyme (PDB 1bd4). b. Close-up view of TgUPRT active site. Positions chosen for mutagenesis are labeled. c. Schematic of (−) TgUPRT versus TgUPRT expressing cell that enable cell-specific metabolic labeling of RNA. d. RNA dot blot is performed after reacting with biotin-azide (for ethynyl RNA) or biotin-tetrazine (for vinyl RNA). RNA was crosslinked to membrane and incubated with streptavidin-horseradish peroxidase (Strep-HRP) followed by staining with methylene blue (Me. Blue) as a loading control. 5-eu= 5-ethynyluracil, 5-euD= 5-ethynyluridine, 5-vu= 5-vinyluracil, 5-vuD=5-vinyluridine. e. ImageJ quantification of chemiluminescence was used to calculate signal-to-noise ratios. Statistical significance relative to WT signal was determined using a one-tailed Student’s t test indicated as follows: P<0.01; **.

