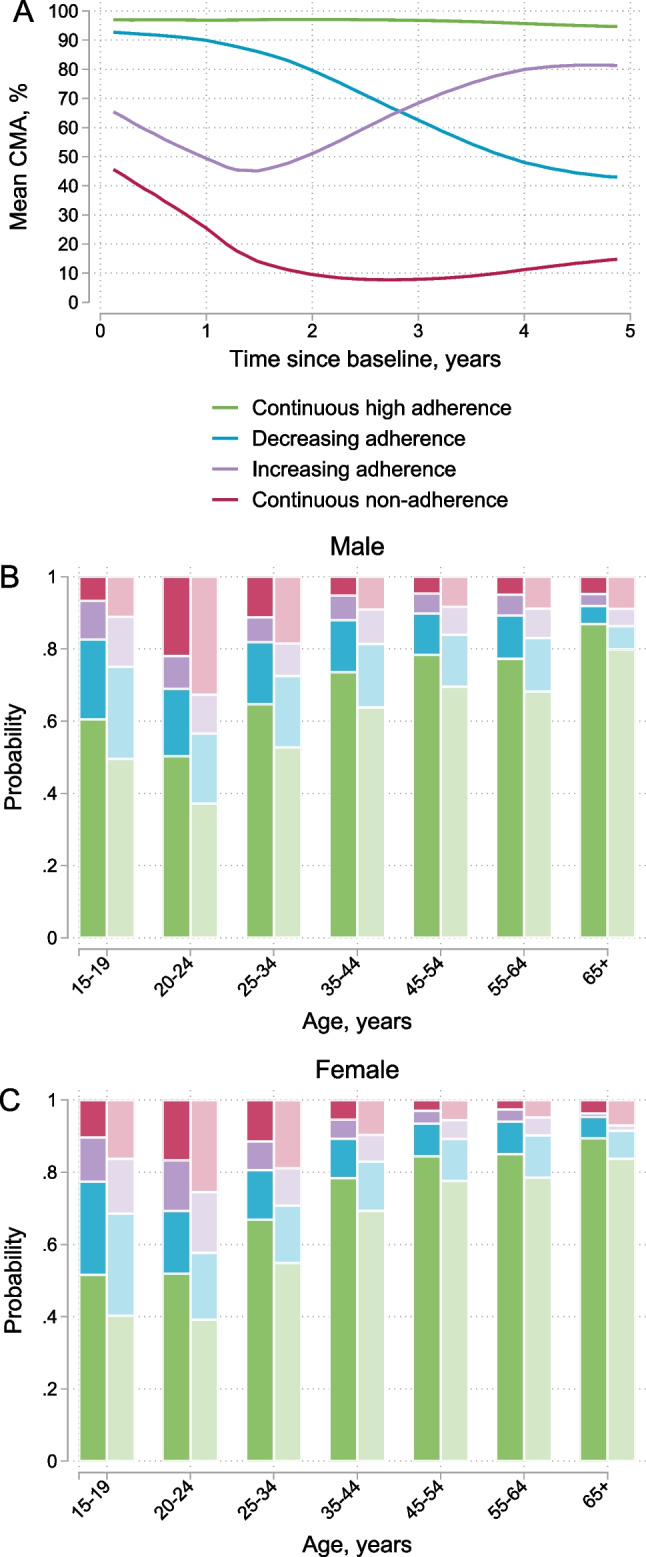
Fig. 2.

Adherence trajectories and the probability of being in each adherence group by sex, age and mental health diagnosis at baseline. A Shows the mean cumulative medication adherence (CMA) for the four groups identified in the longitudinal adherence trajectory analysis. B, C Shows the probability of being in each group by sex, age, and mental health diagnosis at baseline. Darker colours represent persons who did not received mental health diagnoses (ICD10 F00–F99) before or at baseline and lighter colours for those who received mental health diagnoses. We included participants with at least 3 years of follow-up in the analysis (N = 32,254)
