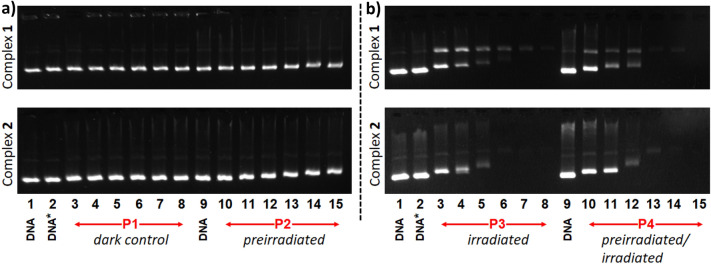
Fig. 4.
Agarose gel electrophoresis images of pBR322 plasmid DNA incubated with 1 and 2 using various complex concentrations (3.13 µM, 6.25 µM, 12.5 µM, 25 µM and 50 µM) and light-exposure conditions (P1–P4 conditions; see main text for details). In all cases, lanes 1, 2 and 9 correspond to DNA control, DNA irradiated with 1050–430 nm light for 30 min (DNA*) and DNA control, respectively. Lanes 3–8 (A), 10–15 (A), 3–8 (B) and 10–15 (B) correspond to samples with increasing complex concentrations. A Conditions applied for complexes 1 and 2: lanes 3–8, dark control (P1) samples without irradiation before or after incubation; lanes 10–15, preirradiated (P2) samples with irradiation before incubation. B Conditions applied for complexes 1 and 2: lanes 3–8, irradiated (P3) samples with irradiation after incubation; lanes 10–15, preirradiated/irradiated (P4) samples with irradiation before and after incubation. [DNA] = 15 µM (in base)

