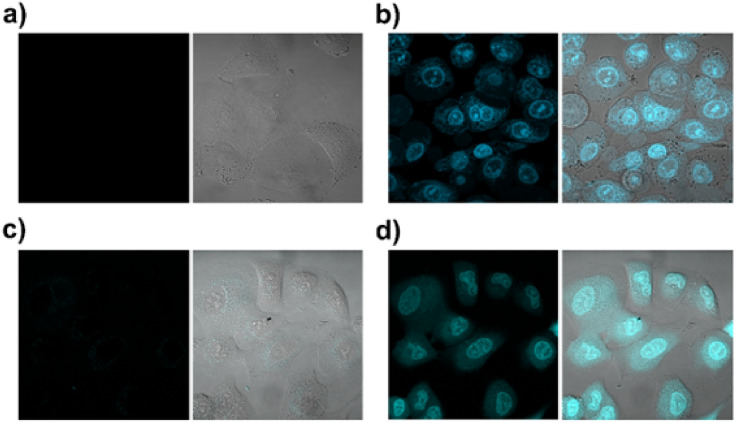
Fig. 8.
Localization of compound 1 inside A549 cells using confocal microscopy. Left images = drug emission; right images = merge of the drug emission with the DIC image contrast. a Non-treated cells pre-irradiated for 1 h with 700–400 nm light. b Cells treated with 20 µM of 1 for 1 h and subsequently irradiated with 700–400 nm light for additional 1 h. c Cells treated for 2 h with 20 µM 1 under dark conditions. d Cells treated for 2 h with 20 µM of 1 under dark conditions and subsequent irradiation for 5 min at 488 nm with the laser of the confocal microscope

