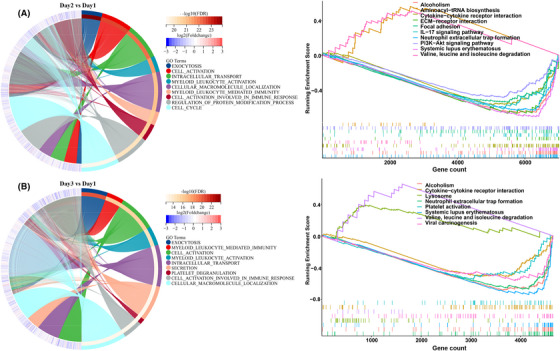
FIGURE 3.

The transcriptome of peripheral blood mononuclear cell (PBMCs) after sleep deprivation. Chord diagram showing enriched biological processes associated with differentially expressed genes, and the results of gene set enrichment analysis (GSEA) to identify potential signaling pathways after sleep deprivation. (A) Chord diagram and GSEA analysis of differential genes on day 2 and (B) day 3. The p value of enriched biological processes and pathways were corrected by Bonferroni‐Holm (BH).
