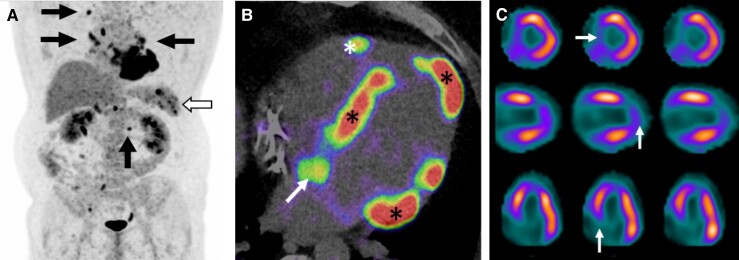
Figure 2.
18F-fluorodeoxyglucose (18F-FDG) positron emission tomography/computed tomography (PET/CT) scans of a patient with tri-fascicular block and depressed left ventricular (LV) function; cardiac sarcoidosis was verified by endomyocardial biopsy. (A) whole-body PET with 18F-FDG positive lymph nodes (arrows) and splenic radiotracer accumulation (hollow arrow). (B) 4-chamber PET/CT image showing 18F-FDG uptake on LV septum, apex, and basal lateral wall (asterisks), on right ventricular free wall (arrow), and on interatrial septum (arrow). (C) Single-photon emission computed tomography 99mTc-tetrofosmin scans showing perfusion defects (white arrows) on LV septum and apex overlapping areas of 18F-FDG uptake on PET (mismatch pattern). From top to bottom, the rows represent short-axis, vertical, and horizontal views of the heart.

