
Fig. 1. Tregs can be expanded concomitantly with HSC and progenitor cell increases in peripheral blood following mobilization with Filgrastim and plerixafor infusion.
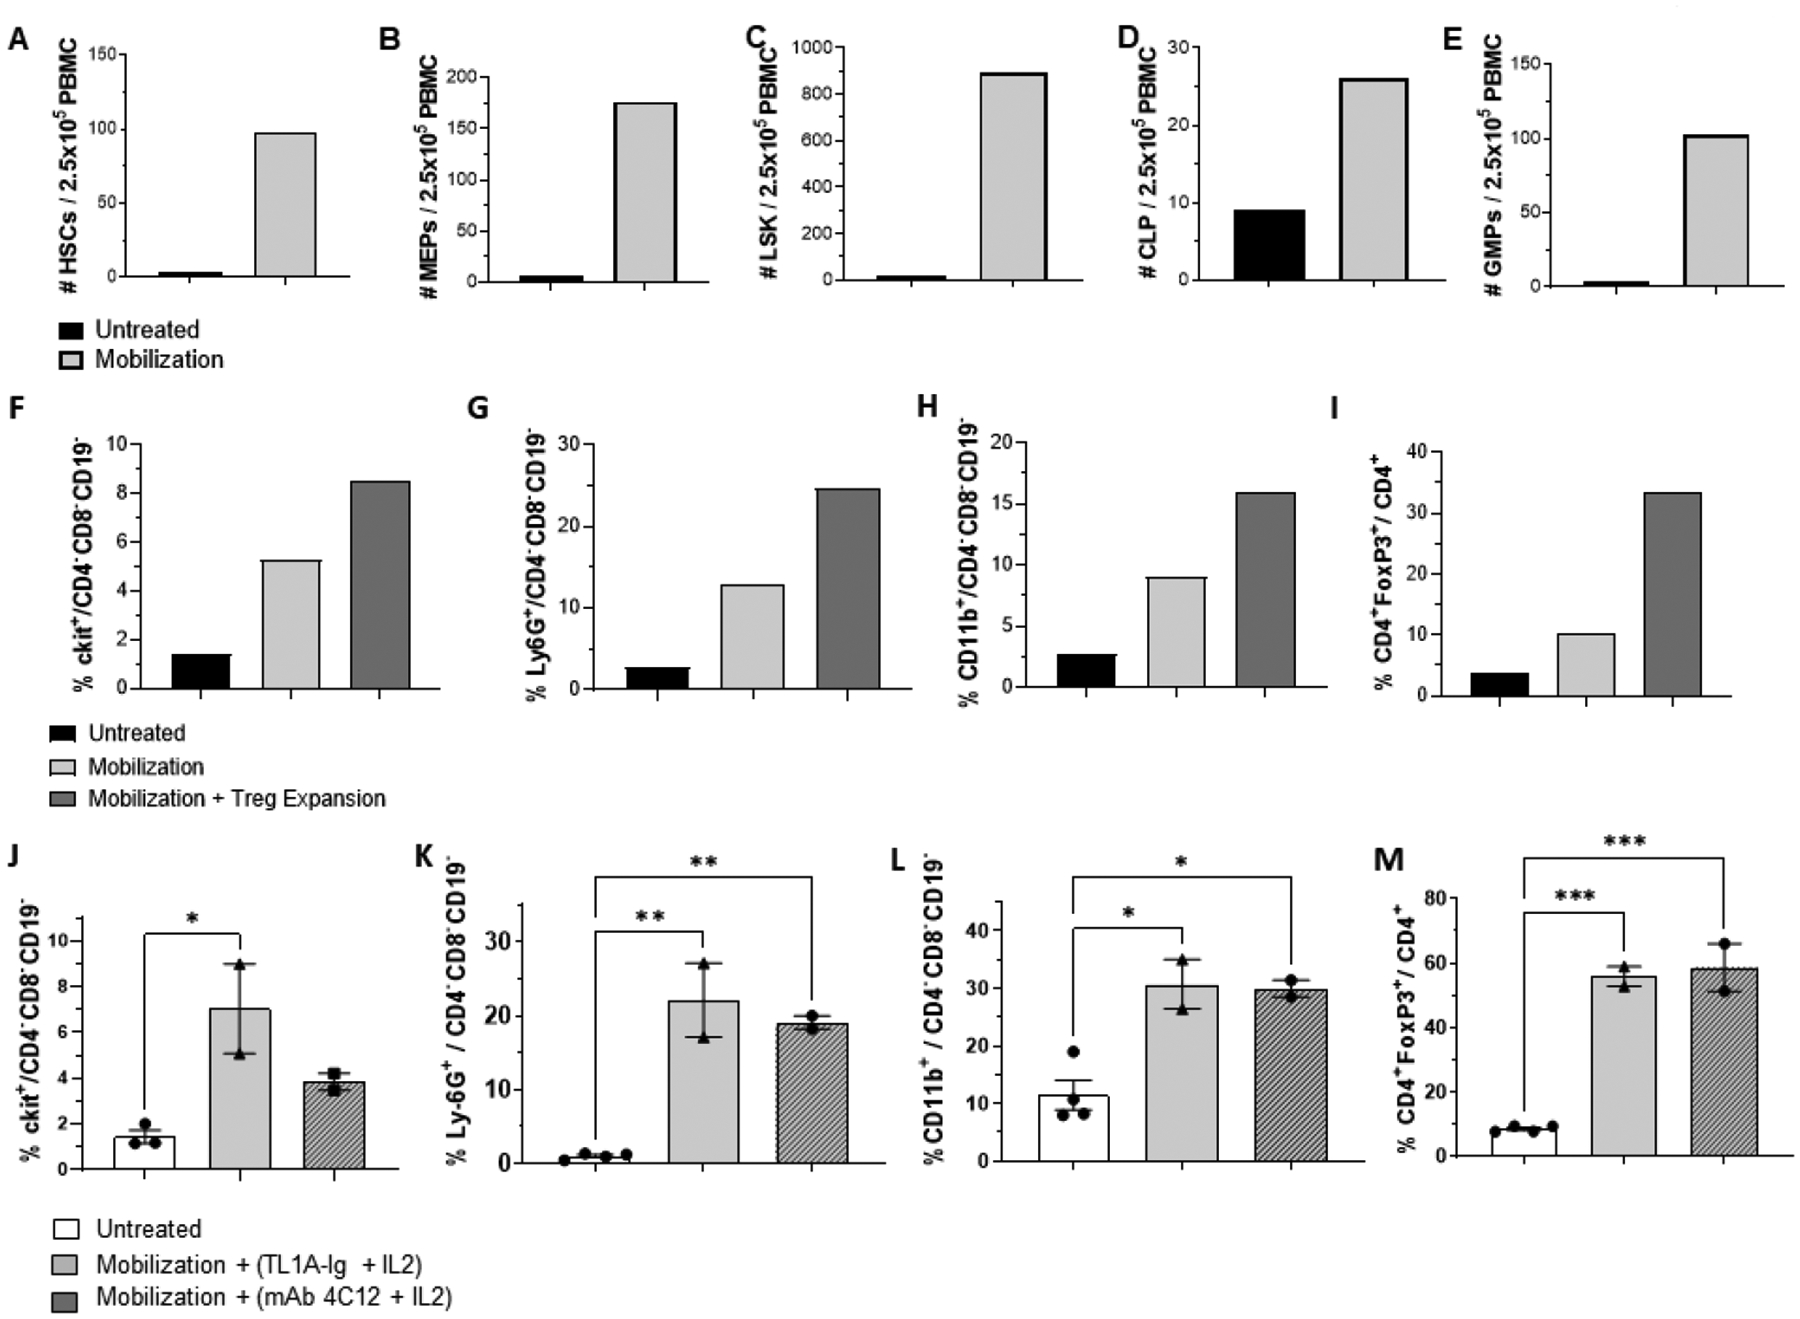
(A-E) B6-Fir,H2b mice were administered rGCSF (2.5ugs / injection) on Days 1–4 daily and plerixafor (5.0mgs/kg) on Days 4 and 5. (Fig. S1). Peripheral blood was collected in the morning of Day 5, 1 hr. following plerixafor injection and PBMC isolated (Methods). Following staining with selected mAbs and analysis via flow cytometry, (A-E) mobilization treatment resulted in 24-, 29-, and 60-fold increases of HSC (A) MEP (B) and LSK (C) populations respectively. CLP (3 fold) (D) and GMP (34 fold) (E) were also elevated compared to control (peripheral blood from non-injected normal mice). Data represents results of pooled peripheral blood from 2 mobilized B6-Fir male mice. (F-I) Mice (LP/J, H2)b were mobilized as above, and administered TL1A-Ig fusion protein and rhIL-2LD. Increased levels of c-kit+ and WBC fractions (F-H populations calculated within the non-lymphoid fraction) together with elevated Treg frequency following mobilization and treatment with TL1a-Ig and rhIL-2LD. Data represents pooled peripheral blood from 5 individual mice in each group (n=5 mice / group). (I) FoxP3+ Tregs within the CD4+ population. Numbers of Tregs were calculated for each group indicated (1.0ml peripheral was collected from each mouse, PBMC collected and pooled (n=5/group). Total PBMC were counted and Treg numbers calculated based on the frequency of CD4+FoxP3+/CD4+ cells. Untreated: 7,502; Mobilized: 102,538; Mobilized plus Treg expansion: 914,514. (J-M) Targeting TNFRS25 with a second agonist (mAb 4C12) also expands Tregs in mobilized peripheral blood. B10.D2 (H2d) mice were mobilized and Treg expanded with either TL1A-Ig (50ug) or mAb 4C12 (100ug) plus rhIL-2LD. (J-L) Heightened levels of c-kit+, myeloid cells and monocytes were detected in mobilized animals receiving eitherTNFRSF25 agonistic reagent. (M) Levels of Tregs were increased in all mobilized B10.D2 animals treated with either agonist (n=2 for mAb 4C12+IL-2LD), n=2 for TL1A-Ig+IL-2LD) vs non-mobilized B10.D2 animals (n=4): Cells per 200ul of peripheral blood = Non-mobilized, 818–984; Mobilized via 4C12, 1640, 2476; mobilized via TL1A-Ig, 1485,3320. (J-M) Data were collected from individual mice and are expressed as mean ± SD and were analyzed by one-way ANOVA with Bonferroni correction for multiple comparisons. *P < .05; **P < .01; ***P < .001; ****P < .0001.