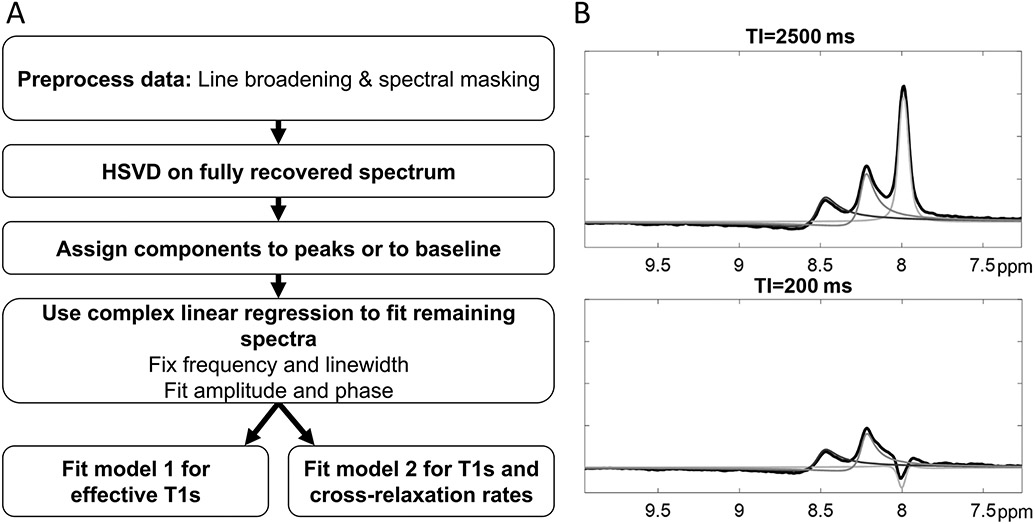
Figure 2:
A, Schematic of MRS data processing to determine effective T1 and cross-relaxation rates. After line broadening and spectral masking, the Hankel SVD is applied to the fully recovered (TI>>T1) spectrum to determine the MRS resonances chemical shift, linewidth, phase and amplitude non-parametrically. Components of the Hankel SVD are then assigned to the spectral resonances or baseline. Then, complex linear regression is used to fit the remaining spectrum (B, example modeled peak fits). Finally, the determined parameters are used to fit the spectrum at other inversion times and fit using either the 3-parameter model or the cross-relaxation model.

