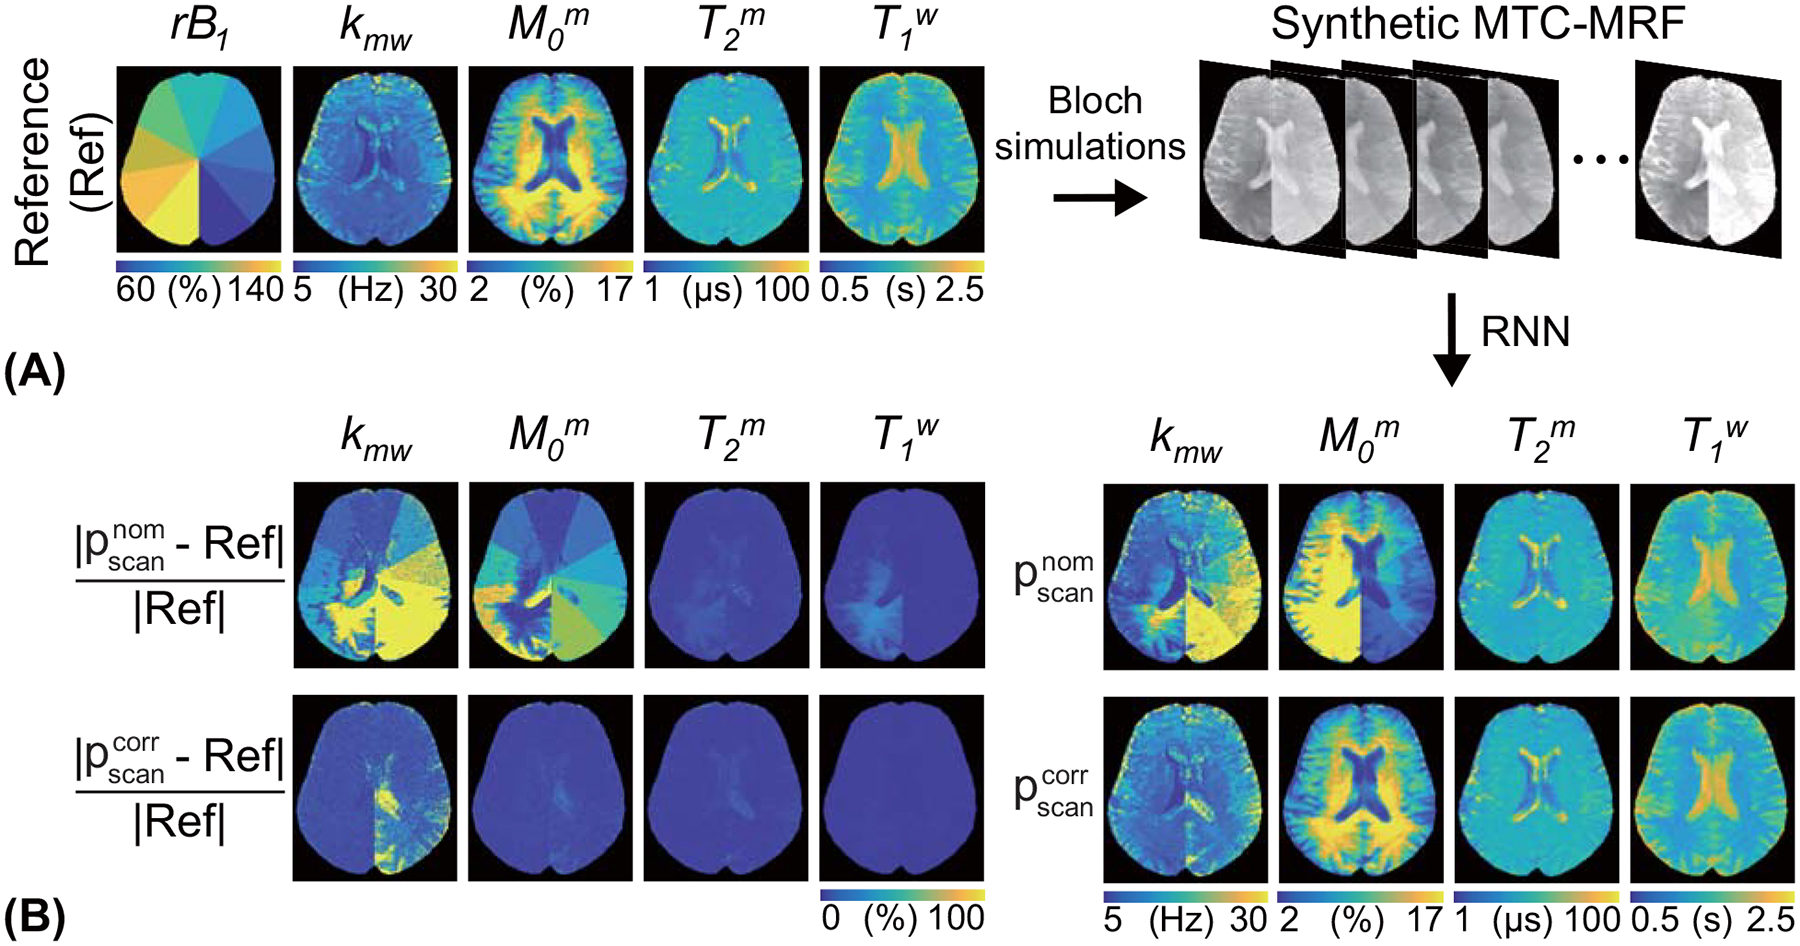
Figure 5.

The sensitivity of the MTC quantification to B1 inhomogeneity was evaluated using a synthetic MRI technique. (A) An illustration of the validation process. The synthetic MTC-MRF images were generated with the simulated relative B1 (rB1) and the reference tissue maps and fed to the trained RNN. The nominal scan parameters () and corrected scan parameters () were used to estimate the quantitative water and MTC maps. (B) Difference images between the reference and the estimated tissue maps are shown.
