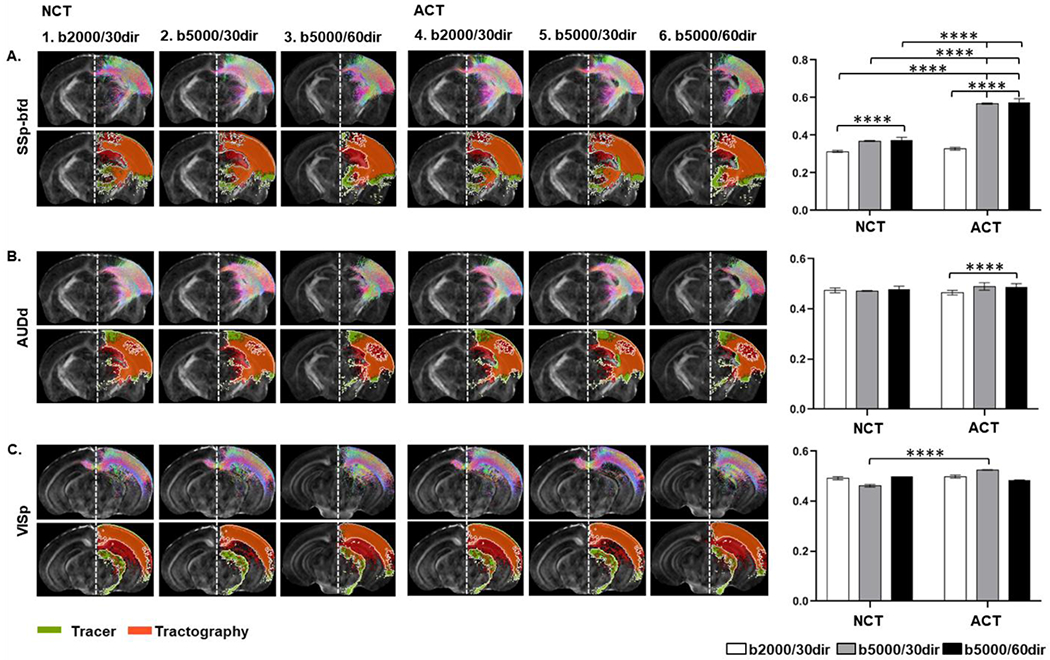
Fig. 8:

Axial slices showing open-end tractography (upper panel) and corresponding tracer maps with boundaries in white and tract density images using six conditions (table 2) overlaid on subject’s FA image: A) Somatosensory barrel field (SSp-bfd, B) Auditory cortex - dorsal area (AUDd) and C) Visual cortex – primary area (VISp). Graphs on the right panel show the level of similarities between tractography and the AMBCA (Two-way ANOVA with Tukey’s multiple comparisons test, α = 0.05)
