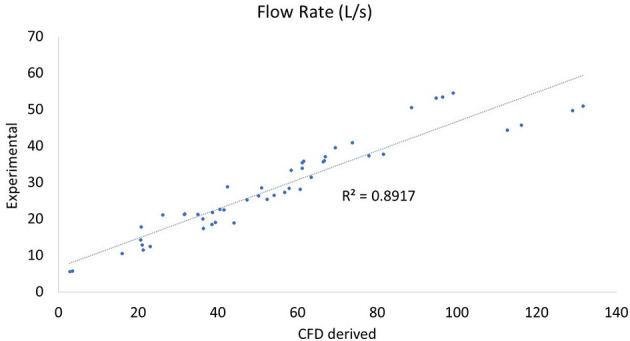
Figure 5.

Plot of CT vs. CFD model derived flow rate. Plot of flow rate in L/s with the correlation coefficient (r2). There were two outlying data points with unusually low reported flow rates which can be seen at the bottom of the plot and correspond to the two outlying points in the impedance plot (Figure 4).
