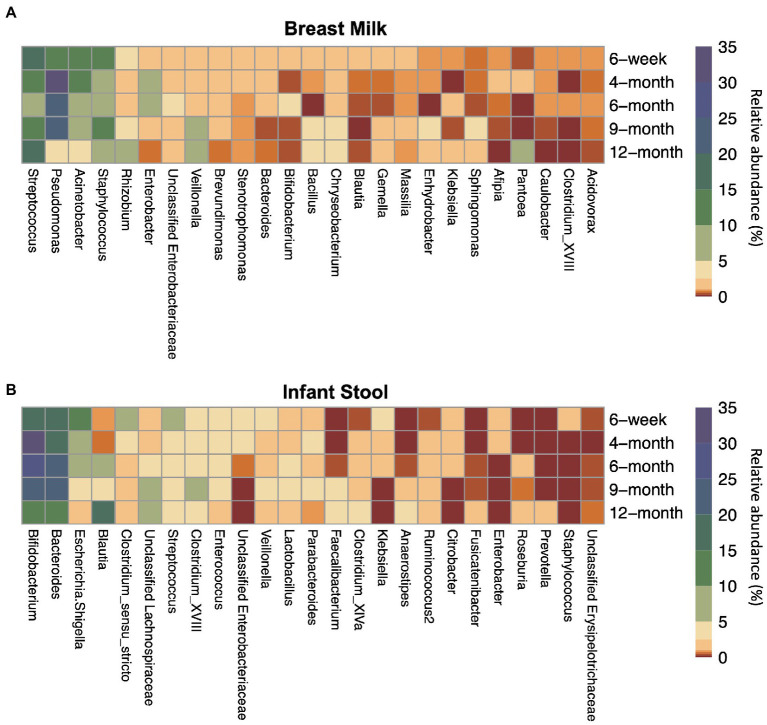
Figure 1.
Top 25 most abundant taxa on average by sample type and timepoint for (A) breast milk and (B) infant stool. Colors indicate the average relative abundance of each taxon. The y-axis indicates the sample collection timepoint. For the x-axis, G indicates the genus while F indicates the family.

