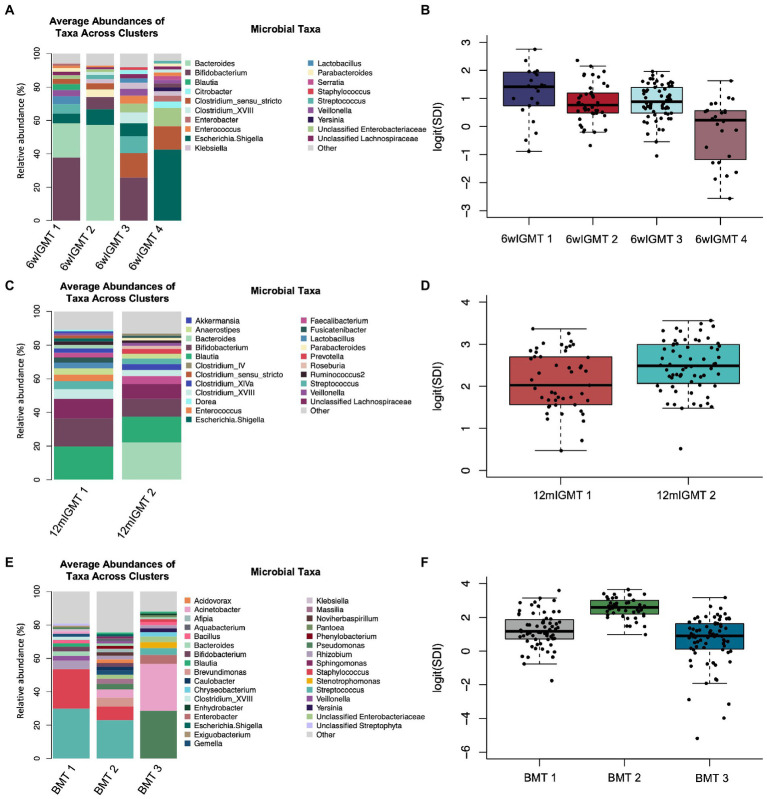
Figure 4.
Infant gut and human milk microbiome clusters. (A) Barplot of the average relative abundance of microbial taxa overall in 6-week infant stool and by 6-week infant gut microbiome type (IGMT). (B) Boxplot of logit(Simpson’s diversity index) by 6-week IGMT (Kruskal-Wallis rank sum test, value of p = 1.6 × 10⁻⁵). (C) Barplot of the average relative abundance of microbial taxa overall in 12-month infant stool and by 12-month IGMT. (D) Boxplot of logit(Simpson’s diversity index) by 12-month IGMT (Kruskal-Wallis rank sum test, value of p = 0.0056). (E) Barplot of the average relative abundance of microbial taxa overall in 6-week breast milk and by 6-week breast milk microbiome type (BMT). (F) Boxplot of logit(Simpson’s diversity index) by 6wBMT (Kruskal-Wallis value of p = 3.3 × 10⁻¹⁶).

