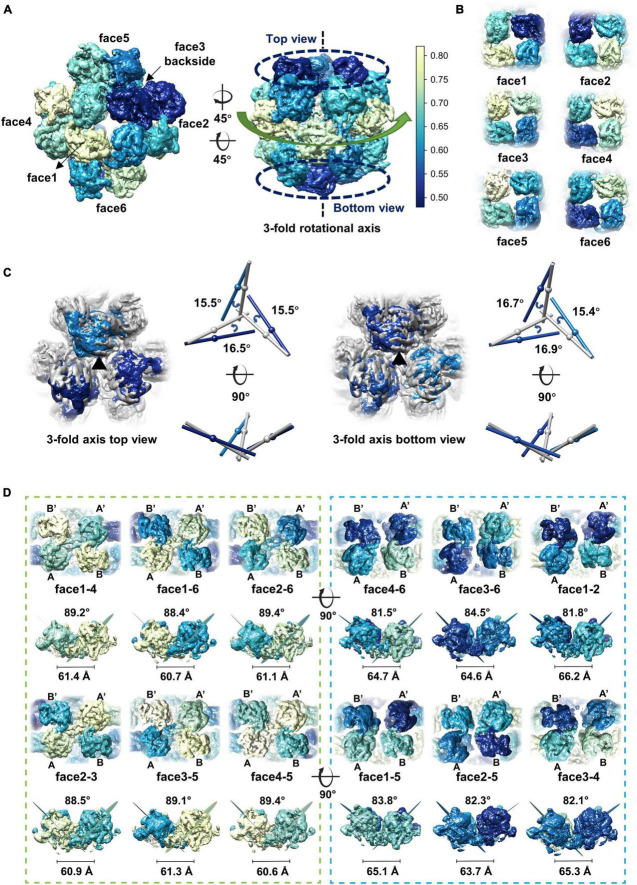
FIGURE 3.
Dynamics of the gp105 monomers in the cube-like assembly. (A) Surface rendered representations showing the cryo-EM maps with the C1 symmetry oriented around the 4-fold rotational axis (left) and the 3-fold rotational axis (right), respectively. Each molecule is colored according to the map CC values calculated with the superimposed C1 and O maps. The C1 map presented is contoured at 2.3 σ. (B) Surface rendered representations showing the six head-to-tail tetramers. Each molecule is colored according to the map CC values calculated with the superimposed C1 and O maps. (C, Left) Surface rendered representations showing the top and bottom of the superimposed assemblies oriented around the 3-fold axis. Molecules in the O map are colored gray. Molecules in the C1 map are colored according to the CC values from light blue to dark blue. (Right) Comparisons of the long axes of the molecules in the O and C1 maps. The long axes of the molecules in the O and C1 maps are colored gray and blue, respectively. (D) Surface rendered representations showing all the concave tetramers in the map with C1 symmetry. The bending angle between the planes and the distance between the gravity centers of the two symmetrical subunits AB’ and A’B on the concave tetramers were calculated and shown.

