FIGURE 1.
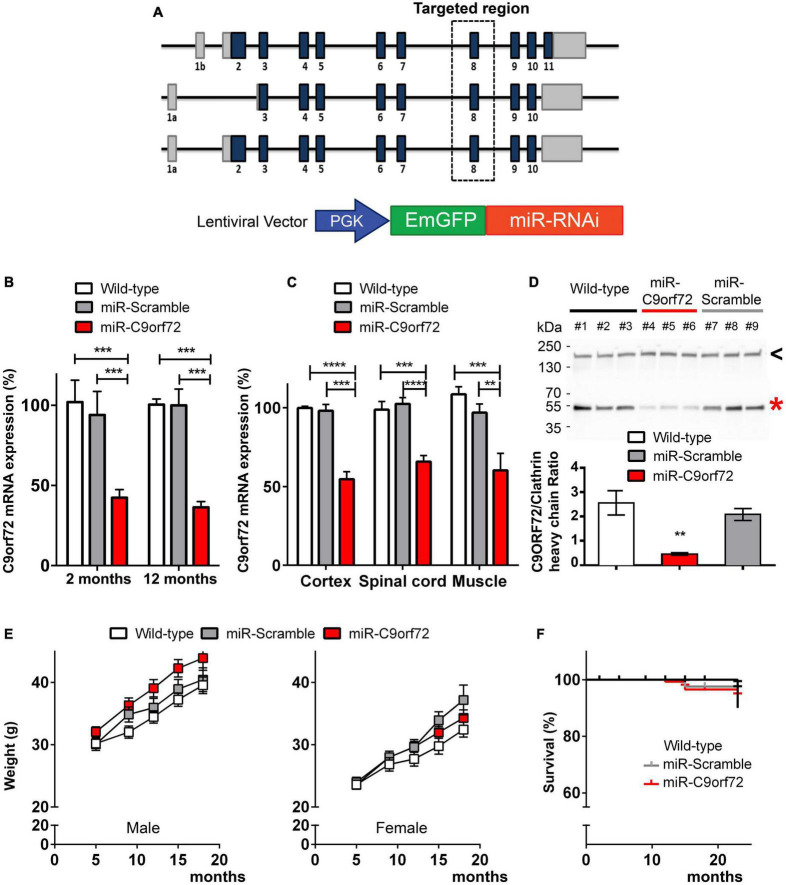
Generation of C9ORF72 knockdown mice. (A) Schematic representation of C9orf72 transcripts in the mouse and the lentiviral vector used to perform transgenesis. MiR-C9orf72 targeted region is denoted by a square zone. (B) Relative expression of C9orf72 mRNA in transgenic mice cortex, at 2 and 12 months measured by qPCR. (wild-type n = 3; miR-Scramble n = 3, c9 n = 6). (C) Relative expression of C9orf72 mRNA in transgenic mice cortex, spinal cord, and muscle measured by qPCR at 23 months (wild-type n = 10; miR-Scramble n = 12, c9 n = 34). (D) Levels of mouse C9ORF72 protein orthoog in the cortex of miR-C9orf72, miR-Scramble, and wild-type mice. The expression of C9ORF72 (red asterisk) was quantified by densitometric analysis of western blots and normalized to clathrin heavy chain (black arrowhead). The positions of the molecular weight marker are indicated on the left in kDa. (E) Weight curve of males (left) and females (right) miR-C9orf72 mice compared to controls (wild-type n = 10; miR-Scramble n = 12, miR-C9orf72 n = 34). (F) Survival curve of C9ORF72 deficient and control animals up to 24 months (wild-type n = 10; miR-Scramble n = 12, miR-C9orf72 n = 34). Error bars represent SEM; *p < 0.05, **p < 0.01, ***p < 0.001, ****p < 0.0001.

