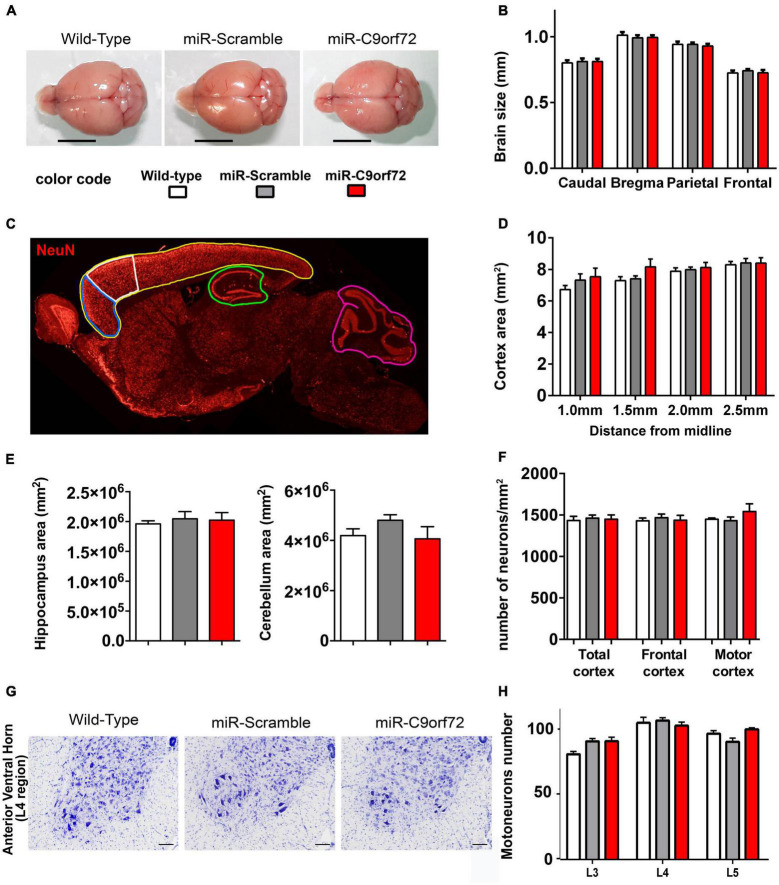
FIGURE 2.
C9ORF72 deficient mice do not present brain atrophy or neurodegeneration. (A) Representative examples of adult brains of miR-C9orf72, miR-Scramble and wild-type mice at 18 months. Scale bar = 5 mm.(B) Macro-measurements of brain width at caudal, bregma, parietal and frontal positions (wild-type n = 4; miR-Scramble n = 4, miR-C9orf72 n = 6). (C) Areas of the brain analyzed: total cortex (yellow), frontal cortex (blue), motor cortex (white), hippocampus (green), and cerebellar (pink) (wild-type n = 4; miR-Scramble n = 4, miR-C9orf72 n = 6). (D) Quantification of the total cortical surface between 1 and 2.5 mm from interaural line. (E) Quantification of the total hippocampal (left) and cerebellar (right) surface at 2 mm from interaural line. (F) Quantification of NeuN-positive cells in the whole cortex area (total cortex) and specifically in the frontal cortex and motor cortex, 2 mm from interaural line. wild-type n = 4; miR-Scramble n = 4, miR-C9orf72 n = 6. (G) Anterior ventral horn sections of C9ORF72 deficient mice and controls at 22 months of age stained with Cresyl Violet (Nissl staining). Scale bar = 200 μ m. (H) Quantification of motor neurons in L3, L4, and L5 sections (wild-type n = 4; miR-Scramble n = 4, miR-C9orf72 n = 6). Error bars represent SEM.

