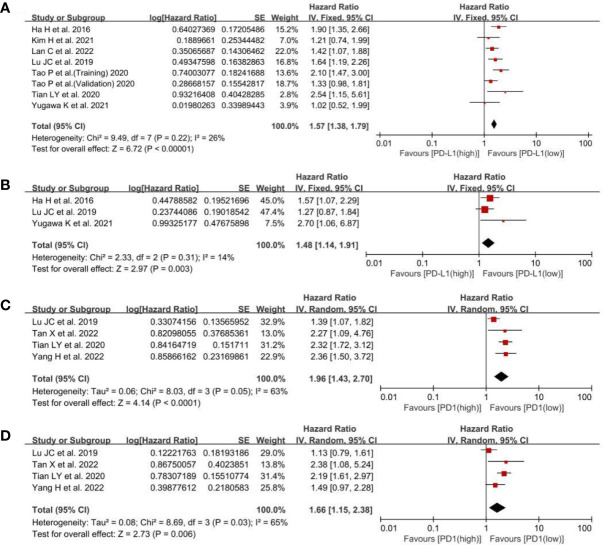
Figure 2.
A forest plot of OS between low- and high-PD-L1 expression: (A) pooled OS by univariate analysis; (B) pooled OS by multivariate analysis. A forest plot of OS between low- and high-PD1 expression: (C) pooled OS by univariate analysis; (D) pooled OS by multivariate analysis.PD-L1, programmed cell death ligand 1; OS, overall survival; SE, standard error.

