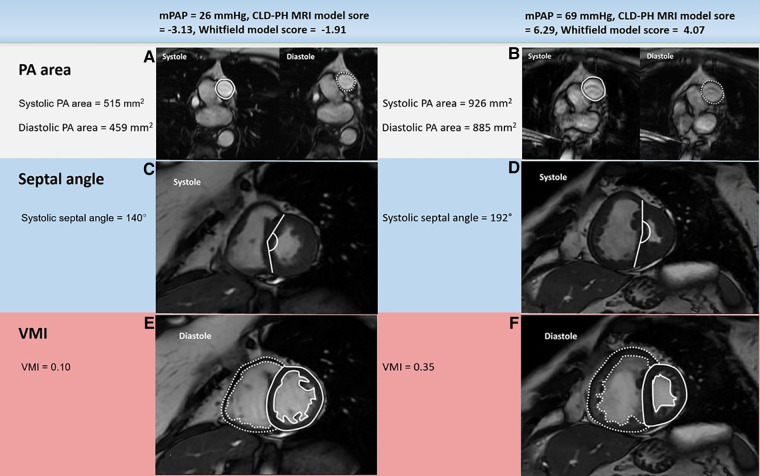
Figure 2.
Example cardiac MRI images in patients with mPAP below (left) or above (right) 35 mmHg: PA area (A, B), systolic septal angle (C, D) and VMI (E, F). The patient with severe PH (right) had much larger systolic and diastolic PA areas, systolic septal curvature and VMI than the patient with mild-moderate PH (left). mPAP: mean pulmonary artery pressure; CLD: chronic lung disease; PH: pulmonary hypertension; PA: pulmonary artery; VMI: ventricular mass index; MRI: magnetic resonance imaging.

