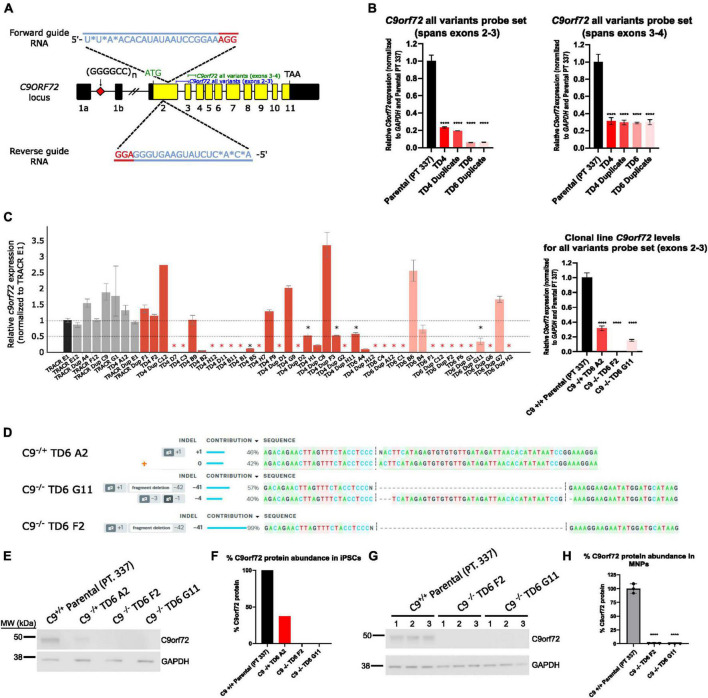
FIGURE 1.
Generation of hemizygous and homozygous C9orf72 knockout induced pluripotent stem cells (iPSCs). (A) Schematic map of the C9orf72 genomic region and the relative binding positions of forward and reverse sgRNA guides used to introduce an INDEL mutation in exon 2, and TaqMan probe sets used to quantify expression. Diagram modified from Shi et al. (2018). (B) Expression of C9orf72 by quantitative reverse transcription polymerase chain reaction (qRT-PCR) in pooled cell populations following Cas9:sgRNA RNP electroporation. Values were normalized to parental cells. ****Denotes p < 0.01 (comparing each pooled cell line to the parental pool by one-way ANOVA analysis of variance followed by Dunnett’s test). Data are presented as mean values ± standard deviations (error bars). (C) Expression of C9orf72 by qRT-PCR in a large screen of isolated clonal lines, as well as in a smaller subset of clonal lines that were used in this study. Black asterisk denotes potential heterozygous KO clones, and red asterisk denotes potential homozygous KO clones. (D) ICE analysis of Sanger sequencing of edited exon 2 region. (E) C9orf72 protein levels shown by Western blotting for iPSC clonal lines. (F) Relative quantification of the C9orf72 protein levels shown in (E). Data are presented as mean values ± standard deviations (error bars). (G) C9orf72 protein levels shown by Western blotting for motor neuron progenitor clonal lines run in triplicate. (H) Relative quantification of the C9orf72 protein levels shown in (G). C9–/– TD6 G11 lane three only contains 10 μg of the total protein (50%) due to insufficient volume.

