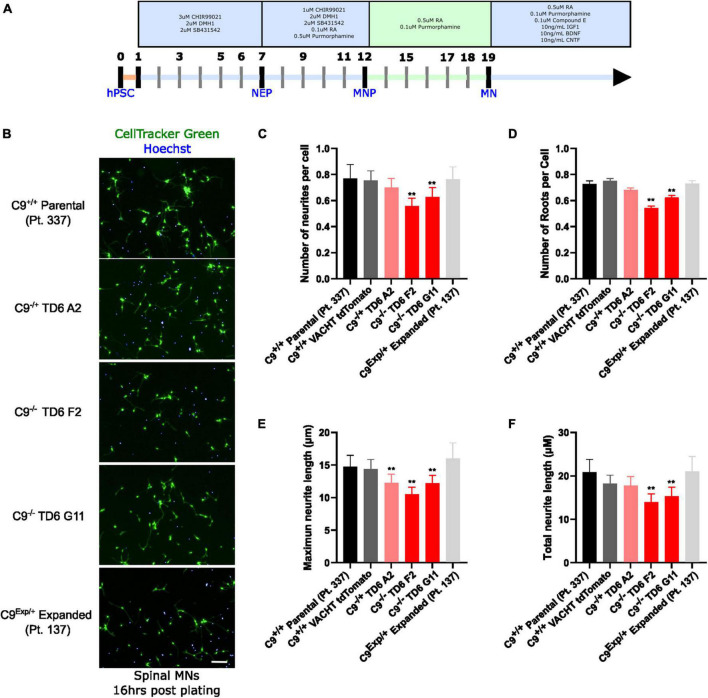
FIGURE 2.
Reduced C9orf72 reduces neurite outgrowth. (A) Schematic timeline for spinal motor neuron differentiation. Adapted from Du et al. (2015) (B) live-cell imaging of spinal motor neurons stained with Cell Tracker Green and Hoechst 16 h after plating. Scale bar = 100 μm. (C) Quantification of the average number of neurite extremities per cell. (D) Quantification of the number of neurite roots per cell. (E) Quantification of the maximum neurite length per cell. (F) Quantification of total neurite length per cell. **Denotes p < 0.01 [comparing each cell line to C9(+/+) parental neurons by one-way ANOVA analysis of variance followed by Dunnett’s test]. Data are presented as mean values ± standard deviations (error bars).

