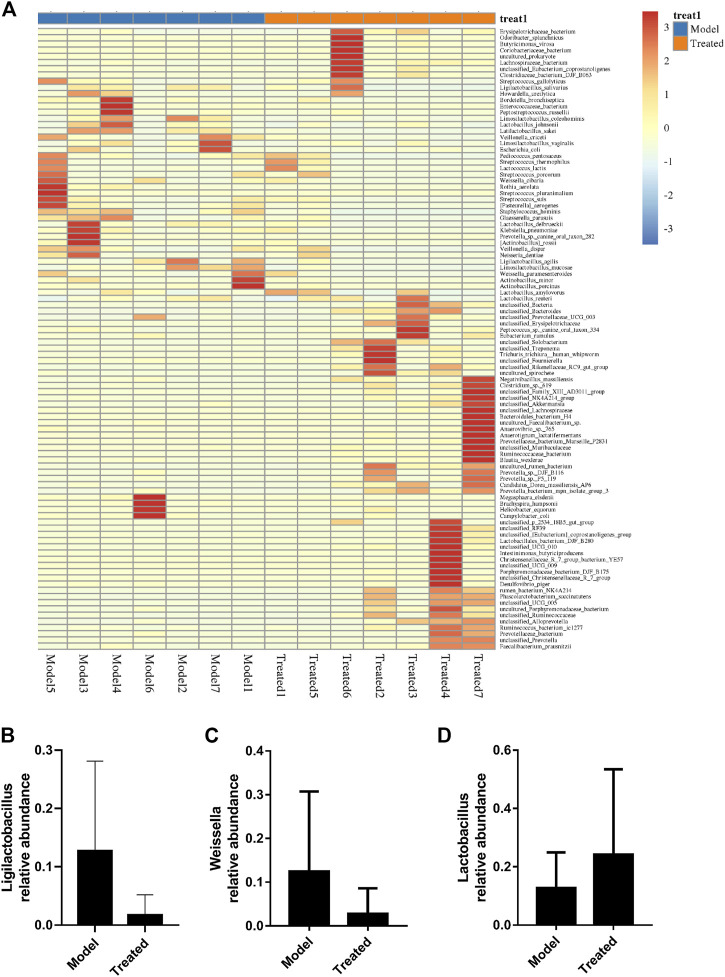
FIGURE 11.
Effects of HJ on intestinal microbiota and key microbiota at the species level. (A) Species composition heat map at the genus level for species clustering. The higher the yellow degree was, the lower the relative abundance of the species was; and the higher the red degree was, the higher the relative abundance of the species was. The contents of (B) Ligilactobacillus_agilis, (C) Weissella_cibaria, and (D) Lactobacillus_amylovorus were measured to evaluate the changes of intestinal microbiota. Data are presented as mean ± SD, n = 7.

