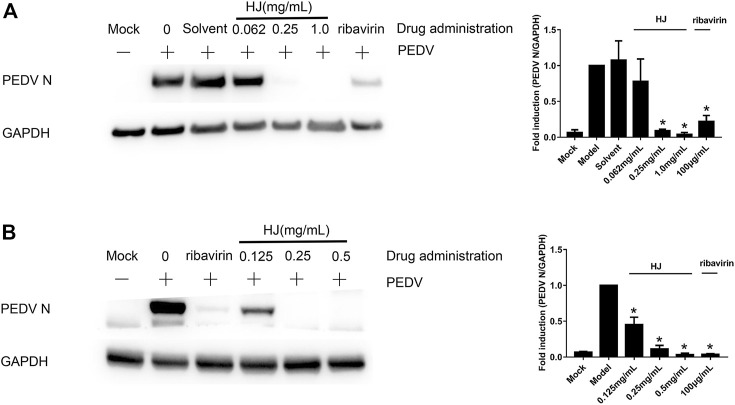
FIGURE 3.
The expression level of PEDV N protein in Vero (A) or IPI-FX (B) cells were examined by western blot assays. Cells were treated with HJ throughout the experiment. The expression level of PEDV N protein was calculated in relation to the expression level of GAPDH at 24 hpi. Results are representative of three independent experiments. Data are represented as mean ± SD, n = 3. *, and p < 0.05 was considered statistically significant compared with the model group.

