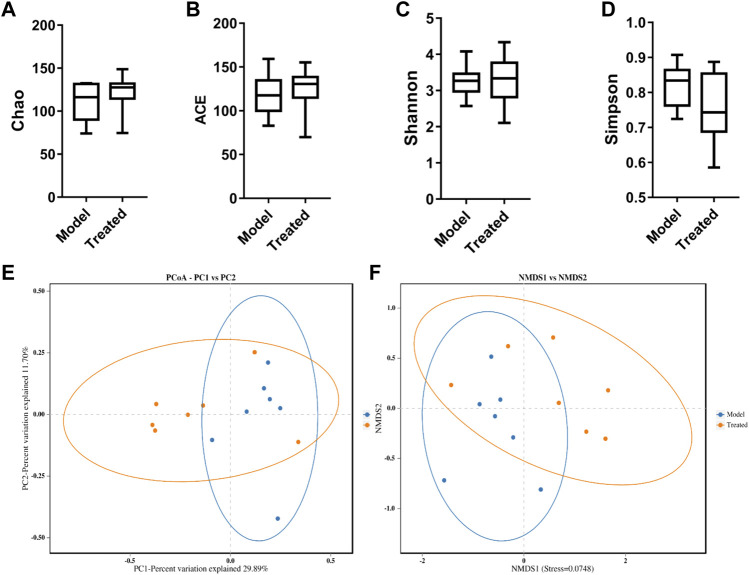
FIGURE 9.
Alpha-diversity and beta-diversity analysis on the intestinal microbiota of piglets. (A) Chao, (B) ACE, (C) Shannon, and (D) Simpson indexes calculated after rarefying to an equal number of sequence reads for all samples. Data are represented as box plots. (E) PCoA of the intestinal microbiota of 10-day-old piglets in different groups. The blue dots represented the model group, and the orange dots represented the treated group. (F) NMSD of the intestinal microbiota of 10-day-old piglets in different groups. Model represents piglets challenged with PEDV, and treated represents piglets received an oral administration of HJ before PEDV challenged. Dots of the same color indicate that they belong to the same group. The closer the dots were, the more similar the composition of the samples was, n = 7.

